

SQL Database Diagram
Creating a database diagram in SQL Server can help you visualize the structure of your database, including tables, relationships, and more. Here’s how you can create a database diagram using SQL Server Management Studio (SSMS):
Please note that database diagrams are a feature available in SQL Server Management Studio (SSMS) for certain editions of SQL Server. They might not be available in every edition.
– Open SQL Server Management Studio (SSMS):
Ensure you have SQL Server Management Studio installed and open it.
– Connect to Your Database:
Connect to the SQL Server instance that contains the database for which you want to create a diagram.
– Select Your Database:
In SSMS Object Explorer, expand the server node, then expand the Databases node. Locate and select the database for which you want to create the diagram.
– Create a New Diagram:
Right-click on “Database Diagrams” under your selected database and choose “New Database Diagram.” If you don’t see the “Database Diagrams” folder, you might need to enable it. To enable it, right-click on your database and select “Tasks” > “Generate Scripts.” Follow the wizard, and check the “Script all objects in the selected database” option. This should enable the “Database Diagrams” folder.
– Add Tables:
Drag and drop tables from the Tables folder onto the diagram.
– Define Relationships:
To define relationships between tables, right-click the first table and choose “Add Related Tables.” Then, click on the second table to create a relationship between them. You can define the relationship properties, such as foreign keys.
– Customize the Diagram:
You can customize the diagram by adding notes, color-coding tables, and arranging them to your preference.
– Save the Diagram:
Save the diagram by clicking the Save button or using the “File” menu.
– Close and Reopen the Diagram:
If you close SSMS and want to reopen your diagram later, you can do so by expanding the “Database Diagrams” folder under your database and double-clicking the diagram.
Please note that while database diagrams in SSMS are useful for visualizing your database structure, they are primarily for documentation and do not have the same functionality as a design tool for creating or modifying database schema. If you need to create or modify database tables and relationships, consider using the Table Designer or SQL scripts.
Remember to back up your database before making any changes to your schema, especially if you’re making changes based on the diagram.
Example:

Course Video
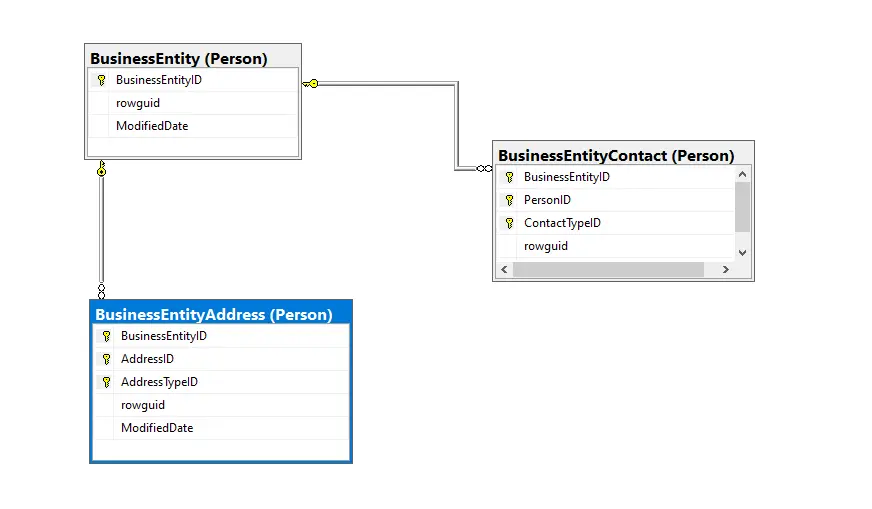
1. Create database diagram using BusinessEntity(person),BusinessEntityContact(person) and BusinessEntityAddress(person) table in ADVENTURE2019 database
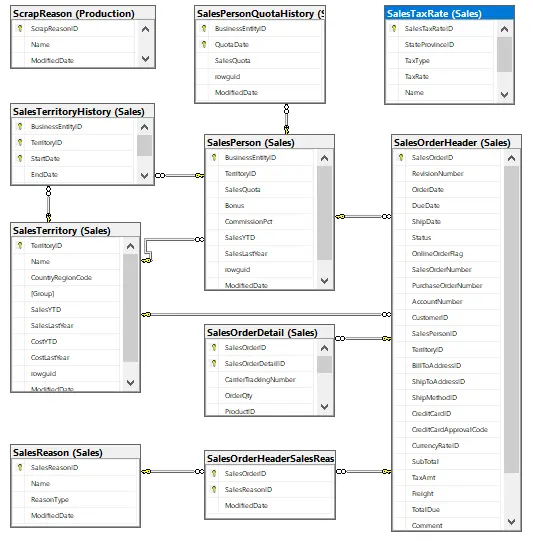
2. Show the relationship between all the tables of sales in ADVENTURE2019 database.
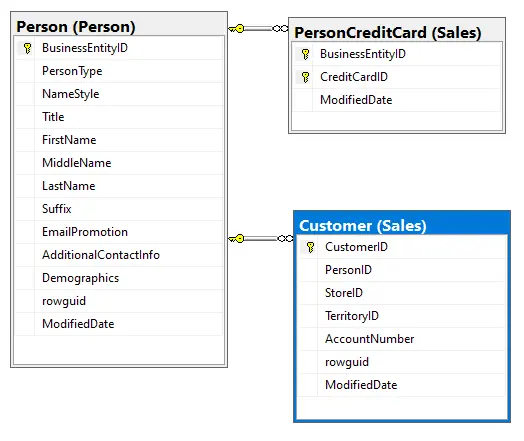
3. Create database diagram to show relationship between Person(Person), PersonCreditCard(sales) and Customer(sales) in ADVENTURE2019 database
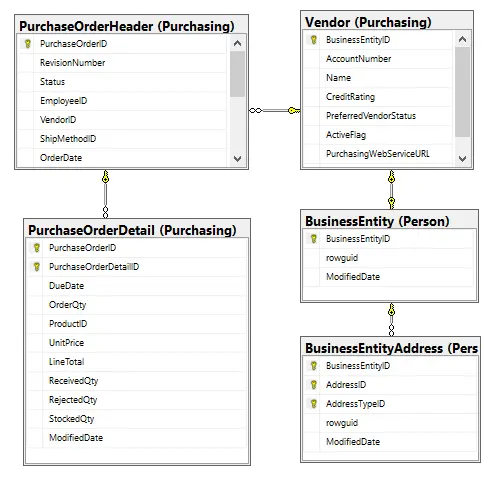
4. Show relationship between PurchaseOrderHeader(Purchasing),Vendor(Purchasing),
PurchaseOrderDetail(Purchasing),BusinessEntity(person) and BusinessEntityAdders(person) from the database
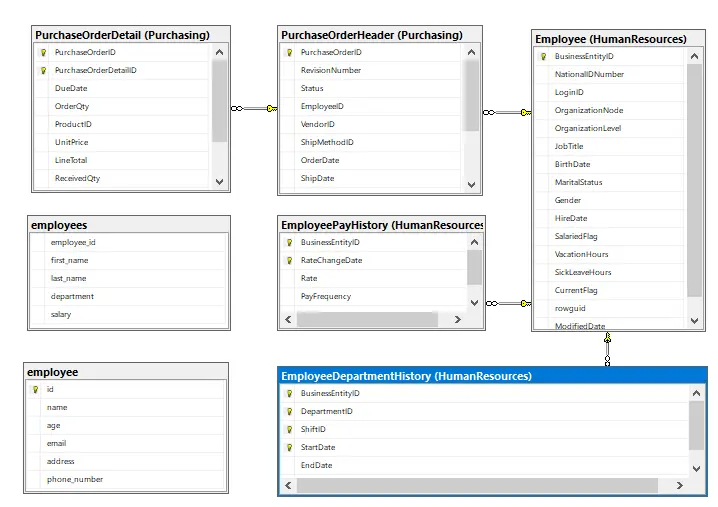
5. Show relationship between all the employee table with purchaseOrderDetail(purchasing) and PurchaseOrderHeader(Purchasing)
YouTube Reference :
1) SQL Datebase Diagram in Hindi/Urdu
2) SQL Datebase Diagram in English
An SQL database diagram visually represents the structure of a database, including tables, columns, relationships, and constraints. It helps in understanding and designing database schemas.
To create a database diagram in SSMS:
- Right-click on the “Database Diagrams” folder in Object Explorer.
- Select “New Database Diagram.”
- Add the tables you want to include in the diagram.
Arrange the tables and save the diagram.
Popular tools include:
- SQL Server Management Studio (SSMS): Built-in for SQL Server users.
- MySQL Workbench: Ideal for MySQL databases.
- DbSchema: A cross-platform tool with advanced features.
- Lucidchart/Draw.io: Online diagramming tools for collaborative design.
- Tables: Represented as rectangular blocks showing columns.
- Relationships: Lines connecting tables to illustrate foreign key relationships.
- Primary and Foreign Keys: Highlighted to indicate table dependencies.
Yes, explore our detailed SQL Database Diagram Tutorials for step-by-step guides and examples.
- Overcrowding diagrams with too many tables.
- Missing relationships or constraints.
- Ignoring normalization principles, leading to redundant data.
Yes, most tools, including SSMS, allow you to modify diagrams by adding or removing tables, adjusting relationships, and changing table properties.
Database diagrams help developers and stakeholders understand the database schema, plan updates, and ensure consistency in database design.
- Database Diagrams: Show the actual database schema with tables, columns, and relationships.
- ER Diagrams (Entity-Relationship): Focus on conceptual data modeling, often used during the design phase.
Yes, most tools allow you to export diagrams as images or PDFs. In SSMS, use screenshot tools or third-party plugins to capture diagrams.
