

Explore Live Power BI Dashboard Demos
Built by Iqra Technology
Power BI Dashboard Gallery


Enterprise-Grade Power BI Dashboards for Every Department
Iqra Technology is a global Power BI consulting and dashboard development company serving clients across the USA, UK, UAE, Canada, and Australia. We build interactive, enterprise-grade Power BI dashboards for Finance, Sales, HR, Marketing, Inventory, Supply Chain, and Operations on systems such as SAP, Oracle, Salesforce, Microsoft CRM, and more — starting at $14 per hour. Browse our live demo dashboards below with no registration required.
Interactive Dashboards
for Your Insights
- ▸Real-Time Overview: Compares actual revenues and expenses against forecasted values
- ▸Detailed Financial Exploration: Deep dives into cash flow statuses and detailed periodical analysis
- ▸Alerts on Deviations: Sends notifications for any significant financial deviations
- ▸Visual Metrics: Intuitive graphs and color-coded indicators for annual financial trends and health
- ▸Real-Time Tracking: Compares actual financial performance against budgets
- ▸Interactive Analysis: Drill down into specific periods and categories
- ▸Variance Alerts: Configurable notifications for deviations from the budget
- ▸Visual Insights: Color coding and trend lines for easy financial health interpretation
- ▸Comprehensive Financial Tracking: Integrated view of Income Statement and Balance Sheet
- ▸Real-Time Budget Analysis: Compares actual financial outcomes against set budgets in real time
- ▸In-depth Periodic Review: Detailed analysis of financial performance over selected periods
- ▸Alerts and Visual Trends: Notifies deviations and visualizes financial health via color coding
- ▸Revenue Trends: Line charts to visualize changes in revenue across specified time periods
- ▸Expense Analysis: Stacked bar charts to show expenses categorized by type over multiple years
- ▸Profitability Metrics: Bar charts illustrating gross, operating, and net profit margins annually
- ▸Cash Flow Statement: Waterfall charts to track monthly or quarterly cash inflows and outflows
- ▸Return on Investment: Gauge charts to highlight annual ROI percentages
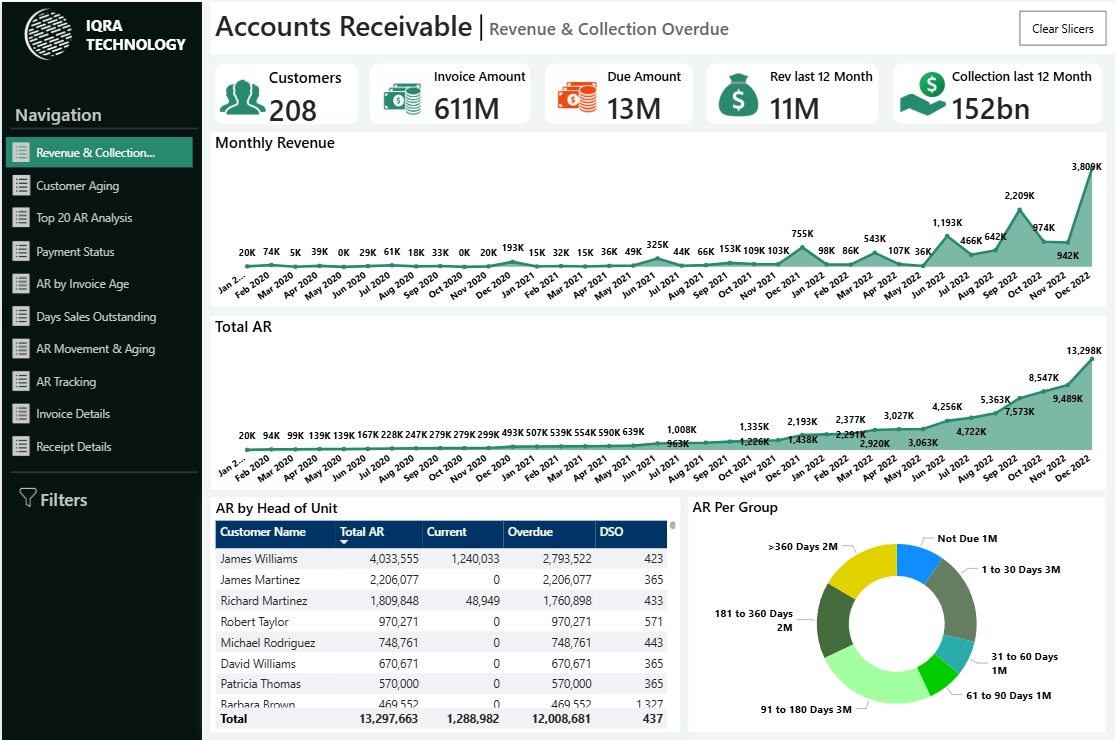
- ▸Total Receivables: Displays total amount owed by customers
- ▸Current vs Past Due: Separates receivables into current and past due categories
- ▸Aging Analysis: Breaks down receivables by age (0–30 days, 31–60 days)
- ▸Top Debtors: Highlights customers with the highest outstanding balances
- ▸Recovery Rates: Measures the percentage of receivables successfully collected
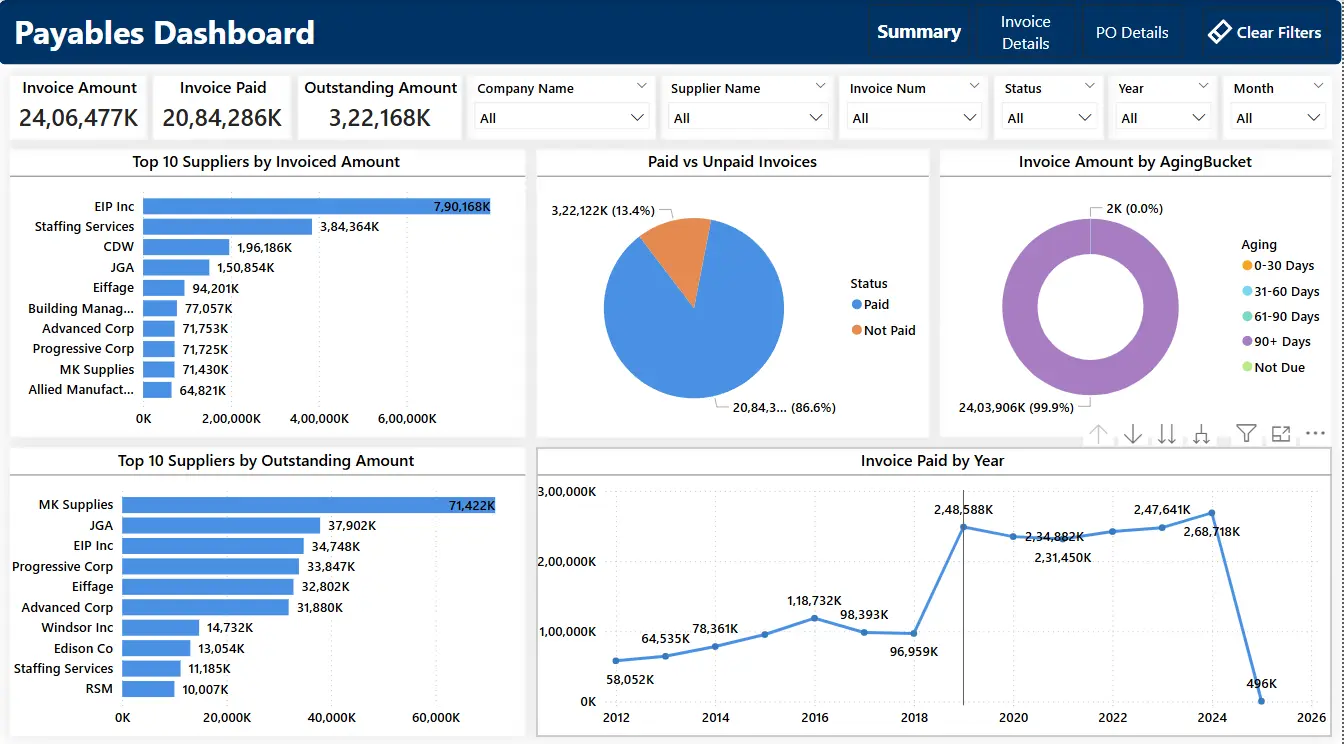
- ▸Total Payables: Displays the total outstanding amount owed to suppliers
- ▸Aging Payables: Breaks down payables by due dates (0–30 days, 31–60 days overdue)
- ▸Top Suppliers: Highlights key suppliers with the largest amounts due
- ▸Payment Due Dates: Shows upcoming payment deadlines to manage cash flow
- ▸Expense Breakdown: Analyzes payables by expense categories
- ▸Total Sales: Displays overall revenue for a selected period
- ▸Sales by Product: Breaks down revenue by individual products or services
- ▸Conversion Rates: Measures the success rate of converting leads to customers
- ▸Top Performing Regions: Identifies regions with the highest sales volume
- ▸Profit Margins: Shows profitability per product or service category
- ▸Real-Time Sales Monitoring: Tracks sales opportunities and conversion rates as they happen
- ▸Interactive Sales Insights: Enables analysis of promotional impacts and leadership performance
- ▸Sales Funnel Visualization: Diagrams the sales process from lead to close
- ▸Performance Metrics: Compares forecasted sales targets against actual achievements
- ▸Total Sales Revenue: Tracks overall sales figures across different periods
- ▸Sales by Category: Analyzes revenue by product categories such as electronics, apparel, and home goods
- ▸Sales by Region: Displays sales performance mapped across geographic regions
- ▸Customer Segmentation: Identifies sales patterns among different customer groups
- ▸Product Performance: Highlights top-selling and underperforming products
- ▸Aging Buckets: Categorizes outstanding balances by invoice age
- ▸Customer Details: Shows contact and account information
- ▸Total Outstanding: Summarizes total receivables
- ▸Historical Comparison: Tracks payment behavior trends
- ▸Dunning Communications: Logs reminders sent to customers
- ▸Real-Time Inventory Tracking: Monitors current stock levels and triggers reorder alerts
- ▸Interactive Purchase Monitoring: Tracks purchase orders and their statuses in detail
- ▸Aging Analysis Insights: Analyzes inventory aging to optimize stock turnover
- ▸Visual Inventory Health: Visual cues and trends to highlight inventory status against benchmarks
- ▸Total PO Value: Displays the cumulative value of all purchase orders issued
- ▸PO Status Tracking: Monitors the status of each PO (Pending, Approved, Completed)
- ▸Supplier Performance: Analyzes supplier reliability and delivery times
- ▸PO Volume by Department: Breaks down PO issuance by department or business unit
- ▸Recent POs: Lists recent purchase orders with items, quantities, and delivery dates
- ▸Contract Value: Displays the total financial value of all active service contracts
- ▸Contract Status: Tracks the status of each contract (Active, Expired, Up for Renewal)
- ▸Expiration Alerts: Alerts for contracts nearing expiration to facilitate timely renewal
- ▸Performance Metrics: Measures service level compliance against contract terms
- ▸Contract Distribution: Analyzes contracts by customer, region, or service type
- ▸Project Status: Displays the current status of all projects (On Track, At Risk, Behind Schedule)
- ▸Budget vs. Actual Spend: Compares the budgeted cost against actual expenditures for each project
- ▸Timeline: Tracks key milestones and deadlines, highlighting any delays
- ▸Resource Allocation: Shows the distribution of resources across projects
- ▸Risk Assessment: Identifies and prioritizes potential risks impacting project timelines
- ▸Pipeline Overview: Shows total leads, closed leads, deal value, conversion rate, and lost rate
- ▸Lead Distribution: Analyzes leads by product type to identify high-demand offerings
- ▸Deal Value Analysis: Compares actual vs expected deal value by month
- ▸Sales Agent Performance: Tracks deal value and closed deals by sales agent
- ▸Conversion Trends: Monitors monthly conversion and lost rates to improve performance
- ▸Task Overview: Displays total tasks, completed, in-progress, not started, and delayed tasks
- ▸Schedule Tracking: Compares actual vs forecasted timelines to monitor progress and delays
- ▸Task Status Insights: Provides visibility into task stages to help teams manage workload
- ▸Project Timeline View: Shows task schedules across weeks and months for better planning
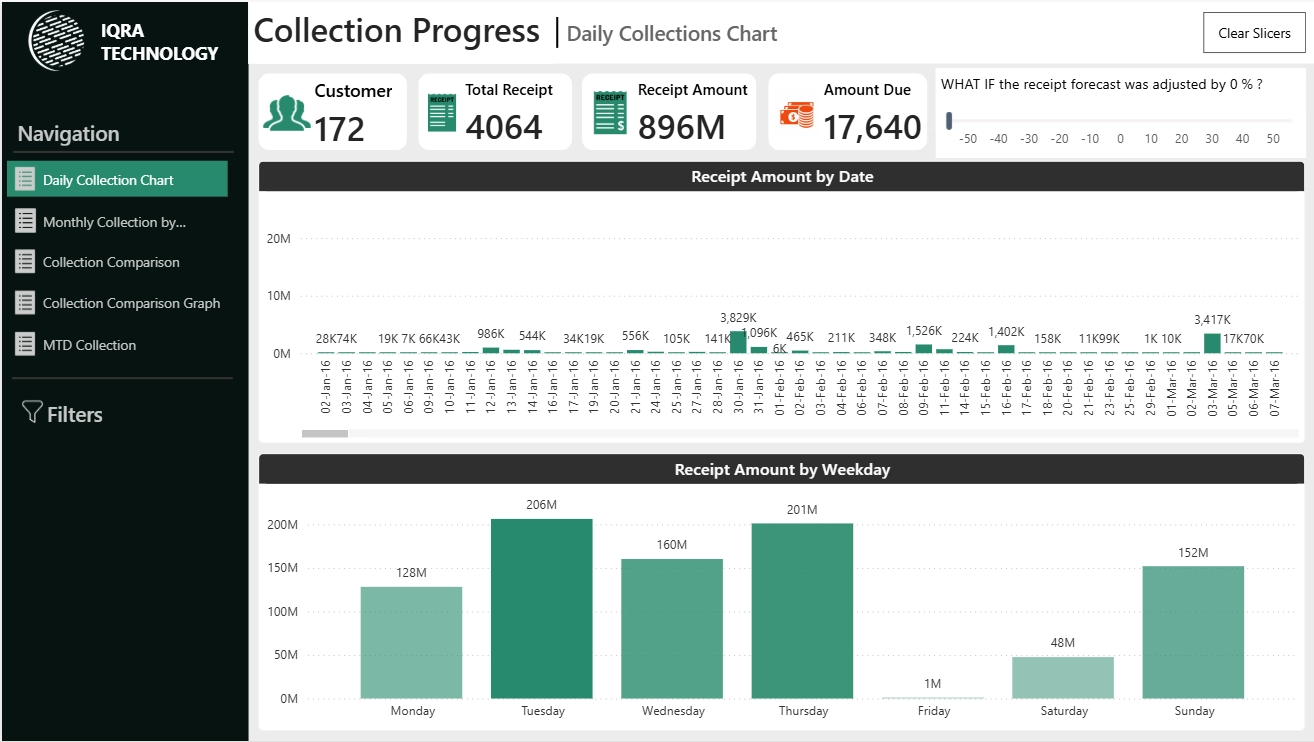
- ▸Collection Overview: Shows total customers, receipts, receipt amount, and outstanding dues
- ▸Receipt Trends: Tracks receipt amounts by date to monitor daily collections
- ▸Weekday Insights: Analyzes receipts by weekday to identify peak collection days
- ▸Outstanding Monitoring: Highlights pending and overdue receivables to improve cash flow
- ▸Forecast Analysis: Enables what-if scenarios to evaluate potential collection outcomes
- ▸Procurement Overview: Shows PO value, invoice amount, paid amount, and outstanding amount
- ▸Procure-to-Pay Trends: Tracks monthly trends of purchase orders, invoices, and payments
- ▸PO Activity Analysis: Displays monthly purchase order counts to identify purchasing patterns
- ▸Vendor Outstanding Insights: Highlights top vendors by outstanding amounts to prioritize payments
- ▸Payment Method Distribution: Visualizes payments by methods such as check, EFT, and others
- ▸Order to Cash Overview: Shows sales amount, invoice amount, payment received, outstanding amount, and collection rate
- ▸Sales vs Payment Trends: Tracks sales, invoice, and payment trends over time
- ▸Customer Sales Insights: Displays top customers by sales and outstanding amounts
- ▸Aging Analysis: Breaks down outstanding receivables by aging buckets to prioritize collections
- ▸Cash Flow Analysis: Visualizes the flow from sales to payments for working capital management
- ▸Sales Overview: Shows total sales orders, order amount, invoices, invoiced amount, and payments from Odoo
- ▸Sales Order Tracking: Displays order details including order number, customer, taxes, amount, and dates
- ▸Invoice & Payment Monitoring: Tracks invoice status and payments to monitor revenue
- ▸Product Sales Insights: Analyzes product performance with price, quantity, and invoice status
- ▸Interactive Filters: Allows filtering by year, month, order, customer, product, and category
- ▸SEO Performance Overview: Displays key website metrics including page views, total visits, event count, and new users
- ▸Technology Insights: Shows page views by technology to identify the most engaging topics
- ▸Traffic Source Analysis: Displays traffic sources like Google, direct, Bing, and others
- ▸User Demographics: Provides user insights by country and region to identify key markets
- ▸Content Performance: Tracks page titles and user interactions to identify high-performing content
Why Businesses Explore Power BI Dashboard Demos Before Signing a Power BI Contract
Most Power BI firms ask you to sit through a pitch before showing you anything real. Iqra Technology does the opposite — most of the dashboards we build are available for you to explore live, before any conversation begins. Here is why that matters:
You see real dashboards, not mockups
Every demo on this page is a fully interactive Power BI report — click filters, drill into data, and navigate exactly as your team would in a live deployment. Nothing is a screenshot or a static image.
You evaluate design quality before committing
Assess visual clarity, interactivity, layout, and whether the style fits your business before spending a single dollar.
You understand what is possible for your industry
Browse dashboards built specifically for finance teams, sales leaders, HR directors, supply chain managers, and operations heads — so you arrive at any consultation already knowing what you want.
You reduce hiring risk
Most firms reveal their work only after you sign. Iqra Technology gives you full access to the actual output quality upfront, so there are no surprises after the contract is signed.
You ask smarter questions
Clients who explore demos first arrive at consultations with clearer requirements, sharper questions, and faster decision-making — saving time and budget on both sides.
You compare fairly
Use our demos to benchmark Iqra Technology's work against any other firm you are evaluating. We are confident in what you will find.
How Iqra Technology Compares to
Other Power BI Consulting Companies
Before you hire any Power BI firm, developer, or agency — see how Iqra Technology compares on the factors that matter most.
| Evaluation Criteria |
Recommended
Iqra Technology
Power BI Specialists
|
Freelance Dev | Generic IT Firm | Large BI Agency |
|---|---|---|---|---|
| Live Dashboard Demos Before Hiring |
Yes — fully interactive demos, no sign-up required
|
Rarely — portfolio screenshots only
|
Never — requires NDA and sales call first
|
Never — static case studies only
|
| Power BI Specialization |
Exclusive — 100% focused on Power BI and Business Intelligence
|
Varies — often a generalist developer
|
No — Power BI is one of 50+ services offered
|
Partial — BI is one practice among many
|
| Hourly Rate |
From $14/hr
|
$30–$80/hr
|
$80–$150/hr
|
$150–$300/hr
|
| Free Trial Available |
Yes — 2-week free trial, zero financial commitment
|
|
|
|
| Oracle Integration |
Yes — specialized ERP-to-Power BI integration service
|
Rarely — limited ERP experience
|
Sometimes — but not a core competency
|
Yes — but at premium rates
|
| Years of Power BI Experience |
Since 2016 — 9+ years exclusively in Power BI
|
Varies — no guarantee
|
Varies — often junior resources assigned
|
Yes — but senior staff rarely on your project
|
| Dashboards Delivered |
500+ Power BI dashboards across 15+ industries
|
Unknown — no verified track record
|
Unknown — no Power BI-specific count
|
High volume — but standardized templates
|
| Industries Served |
15+ incl. Finance, Retail, Manufacturing, Healthcare, Logistics, Real Estate
|
Depends on individual
|
Broad but shallow
|
Broad but expensive
|
| Post-Launch Support |
Yes — 2 weeks complimentary included in every project
|
Rarely — ad hoc and unreliable
|
Extra cost — billed separately
|
Yes — expensive retainer required
|
| Dedicated Developer Model |
Yes — developer works as part of your team, hourly/part-time/full-time
|
Yes — but no backup if unavailable
|
No — shared resource pool
|
No — team rotates constantly
|
| Countries Served |
USA, UK, UAE, Canada, Australia, India
|
Typically one country
|
Typically one region
|
Global — but inconsistent quality
|
| Contract Required to See Work |
No — all demos are publicly available
|
Yes — portfolio on request only
|
Yes — NDA required
|
Yes — formal RFP process required
|
| Risk to Client |
Very Low — free trial + live demos before commitment
|
High — no vetting mechanism
|
Medium — long contracts, high exit cost
|
High — large upfront commitments required
|
How Iqra Technology's Power BI Dashboards Can Transform Your Business Insights
These live demos are a direct reflection of our expertise in Power BI development. When you explore the dashboards on this page, you will:
See how we visualize data
Clear, actionable insights delivered through engaging, interactive reports built for real business decisions.
Understand our approach
Every dashboard on this page is a customized solution built around specific business needs, not a generic template.
Consider the possibilities
See how similar dashboards could solve your specific challenges in finance, sales, operations, inventory, supply chain, and more.
What Our Power BI Dashboards Deliver
Real-Time Insights
Stay ahead with live, up-to-date data refreshed automatically at your fingertips.
Interactive Visuals
Use dynamic layouts, drill-downs, and filters to explore your data at any level of detail.
Multi-Source Integration
Connect Power BI to ERP systems, CRM platforms, cloud databases, Excel, SQL, Salesforce, Oracle, SAP, and more.
AI-Driven Analytics
Leverage predictive analytics and intelligent forecasting to identify trends before they impact your business.
Custom Visualizations
Every dashboard is tailored to your KPIs, branding, and reporting requirements with full drill-down capability.
Mobile-Friendly Access
Access your dashboards anytime, anywhere using Power BI mobile applications.
Enterprise Security
Row-level security, Azure Active Directory authentication, and Microsoft's enterprise-grade governance built into every deployment.
Automated Alerts and Reports
Receive instant notifications when KPIs change and schedule reports without any manual intervention.
Ready to Build Your Power BI Dashboard?
You have seen the quality.
Now let us build one for your business.
Explore our live demos and evaluate quality before signing any contract. Services from $14/hr · 2-week free trial · Zero financial commitment required.
Frequently Asked Questions
Everything you need to know about Iqra Technology's Microsoft Power BI Demo page, dashboard capabilities, services, pricing, and how to get started.
What is the Iqra Technology Microsoft Power BI Demo page?
The Iqra Technology Microsoft Power BI Demo page is a free, publicly accessible library of live, interactive Power BI dashboards built by Iqra Technology's certified development team. It showcases real Power BI dashboard examples across Finance, Sales, HR, Marketing, Inventory, Supply Chain, Operations, on systems such as SAP, Oracle, Salesforce, Microsoft CRM, etc.— allowing businesses to explore Iqra Technology's work quality before signing any contract or speaking to a salesperson.
What is Power BI and why does it matter for my business?
Power BI is Microsoft's business intelligence platform that enables organizations to connect to multiple data sources, transform raw data into interactive visualizations, and share real-time dashboards across teams. For businesses, Power BI replaces manual Excel reporting with automated live dashboards — reducing reporting time from days to hours. Every dashboard in this Microsoft Power BI Demo showcases what Power BI achieves when built by a specialist consulting team like Iqra Technology.
Who built the Power BI dashboards on this demo page?
Every dashboard in this Power BI Demo was built by Iqra Technology — a specialist Power BI consulting and dashboard development company founded in 2016, headquartered in Thane, Maharashtra, India, with a presence in Sharjah Media City Free Zone, UAE. Iqra Technology has delivered 500+ Power BI dashboards across 15+ industries for clients in the USA, UK, UAE, Canada, and Australia — starting at $14 per hour.
Are the Power BI demo dashboards live and interactive?
Yes. Every dashboard in Iqra Technology's Power BI Demo is fully interactive — not a screenshot, mockup, or pre-recorded video. Visitors can click filters, apply slicers, drill into specific data points, and navigate between report pages exactly as users would in a live production deployment. No registration or sign-up is required to explore any Power BI demo dashboard on this page.
What Power BI dashboard demo examples are available on this page?
Iqra Technology's Microsoft Power BI Demo page includes live interactive dashboards for Finance, Actual vs Budget, Profit and Loss, Sales, Sales Pipeline, Inventory, Payables, Receivables, Customer Aging, Purchase Orders, Project Tracking, Service Contracts, Oracle Fusion Collection, Oracle Procurement to Payment, Oracle Order to Cash, Odoo Sales, CRM Sales Performance, Google Analytics SEO, and Project Task Scheduling — all accessible without registration. You can also explore how these dashboards are structured in our Top 10 Power BI Dashboards blog.
Can I explore a Power BI demo dashboard before hiring Iqra Technology?
Yes — that is exactly what this page is for. Iqra Technology's Power BI Demo page gives every prospective client free access to live, interactive Power BI dashboards across Finance, Sales, HR, Marketing, Inventory, Supply Chain, and ERP systems including Oracle and SAP — before any contract is signed, any call is booked, or any form is submitted. You can explore our Power BI demo dashboards to evaluate our dashboard quality, reporting capabilities, visualization styles, and real-world business intelligence solutions before engaging with our team. Explore the demos and reach out only when you are ready.
What Power BI services does Iqra Technology provide?
Iqra Technology provides custom Power BI dashboard development, Power BI consulting and KPI strategy, data modeling and DAX optimization, ERP integration with SAP and Oracle, Power BI Embedded development, dedicated Power BI developer hiring, Power BI managed services, and Power BI training and team enablement. All services are available on an hourly, part-time, or full-time basis — starting at $14 per hour with a free 2-week trial.
Can the Power BI demo dashboards be customized for my business?
Yes. Every dashboard shown in this Power BI Demo represents Iqra Technology's ability to build fully customized Power BI solutions. The dashboards your business receives will be tailored to your specific data sources, KPIs, branding, and reporting requirements — not adapted from a generic template. Iqra Technology's customization process begins with a discovery session where consultants define your exact metrics, data connections, and visual requirements before a single report page is built.
Can Iqra Technology integrate Power BI with Oracle ERP systems?
Yes. Iqra Technology specializes in integrating Microsoft Power BI with Oracle ERP systems including Oracle ERP Cloud, Oracle Fusion, and Oracle E-Business Suite. Live Power BI demo dashboards for Oracle — including Oracle Fusion Collection Progress, Oracle Procurement to Payment, and Oracle Order to Cash — are available to explore on this page before any engagement begins.
How much does it cost to hire a Power BI developer from Iqra Technology?
Iqra Technology's Power BI services start at $14 per hour. Full-time dedicated developer engagement is approximately $2,300 per month and part-time is approximately $1,380 per month. A 2-week free trial is available for all new clients — allowing businesses to evaluate dashboard quality, team communication, and delivery standards with zero financial commitment before signing any contract.
How secure are Power BI dashboards built by Iqra Technology?
Power BI dashboards built by Iqra Technology include enterprise-grade security features — row-level security, Microsoft Azure Active Directory authentication, end-to-end data encryption, and compliance with Microsoft's enterprise security standards. All security settings are configured during implementation based on your organization's specific access control requirements.
How do I get started with Iqra Technology's Microsoft Power BI Demo or services?
Start by exploring the live Power BI demo dashboards on this page — no registration required. When you are ready, use the contact form or book a free 30-minute consultation with an Iqra Technology Power BI expert. The consultation covers your data sources, KPI requirements, and dashboard scope at no cost and with no obligation to proceed. Services start at $14 per hour with a 2-week free trial available for all new clients.
Ready to Build Your Power BI Dashboard?
Start with a free 2-week trial — no obligation, no hidden charges.
