

Power BI vs Tableau vs Qlik:
Which Analytics Tool
is Right for You?
A definitive feature-by-feature breakdown across ease of use, pricing, performance, data connectivity, and real-world use cases.

Faraz Shaikh
But with multiple options available, how do you choose the right tool? In this guide, we compare Power BI, Tableau, and Qlik Sense across key features, pricing, performance, ease of use, and real-world use cases — so you can make a confident, informed decision.
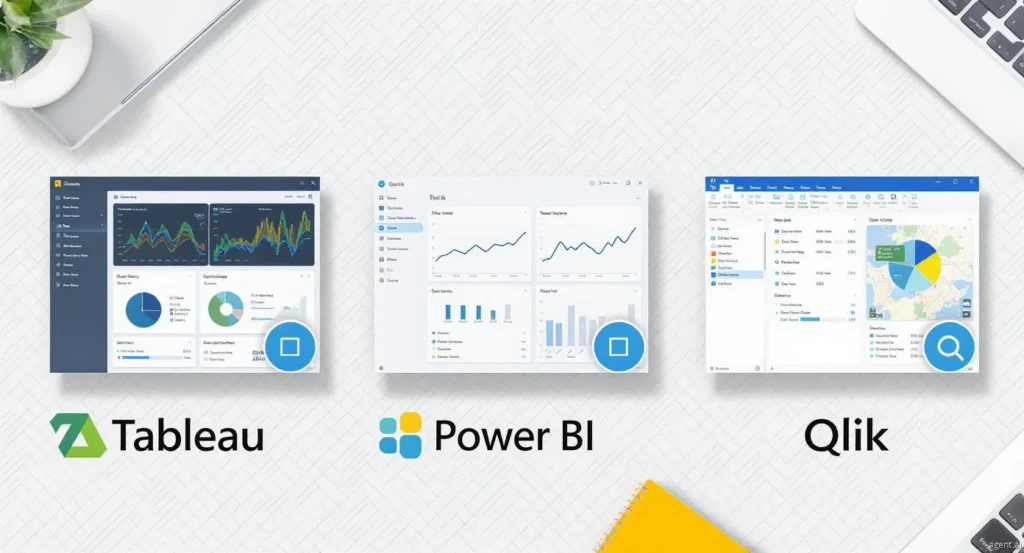
Meet the Contenders
⚡ Microsoft Power BI
A business intelligence tool by Microsoft for visualizing data, building interactive reports, and creating dashboards. Known for ease of use and deep integration with the Microsoft ecosystem — the fastest path from raw data to a live, shareable dashboard.
📊 Tableau
A powerful data visualization platform renowned for handling large datasets and creating visually compelling, interactive dashboards. Acquired by Salesforce in 2019, it benefits from enterprise-grade support and deep CRM integration.
🔗 Qlik Sense
Built around an associative data engine — a fundamentally different approach that allows users to explore data dynamically in any direction, without predefined query paths. Ideal for organizations with complex, siloed data environments.
Feature-by-Feature Comparison
Ease of Use
Power BI is the most beginner-friendly of the three. Its interface will feel immediately familiar to anyone who has used Excel. Non-technical users can build working dashboards within hours using the drag-and-drop report builder, and Power Query handles data transformation without requiring SQL knowledge.
Tableau offers an intuitive canvas-based experience that makes creating complex visuals surprisingly accessible. However, mastering advanced features — such as Level of Detail (LOD) expressions, table calculations, and Tableau Prep — requires a moderate learning investment.
Qlik Sense has a clean, modern interface, but the associative engine introduces concepts that are unfamiliar to most analysts. Organizations adopting Qlik should budget for structured onboarding and ongoing training.
Verdict: Power BI is the clear winner for beginners and self-service users. Tableau and Qlik reward users who invest in learning them.
Data Connectivity
Power BI offers 300+ native data connectors, including Azure, SQL Server, Dynamics 365, SharePoint, Salesforce, Google Analytics, and hundreds of cloud services. Power Query provides a visual, code-optional transformation layer before data enters the model.
Tableau supports a broad connector library spanning relational databases, cloud platforms, spreadsheets, and big data systems. Tableau Prep enables visual, pipeline-based data preparation without writing code.
Qlik provides strong connectivity with a unique advantage: its associative engine automatically infers and links relationships across disparate data sources — reducing the need for manual joins and enabling faster multi-source analysis.
Verdict: All three tools offer excellent connectivity. Qlik stands out for its automatic associative linking across data sources.
Data Visualization
Power BI includes a solid built-in visual library and access to Microsoft's AppSource marketplace for custom visuals. It is excellent for standard business reporting, KPI dashboards, and branded internal reports.
Tableau is the industry benchmark for data visualization. Its pixel-level control, rich interactivity, animation support, and storytelling features allow analysts to create dashboards that are both deeply functional and visually exceptional. No other BI tool matches Tableau's visualization flexibility.
Qlik Sense offers a respectable set of visualization options, enhanced by its associative highlighting — when a user clicks any data point, related and unrelated data is immediately highlighted across all charts simultaneously. The focus is on exploration rather than aesthetic output.
Verdict: Tableau is the undisputed leader in data visualization quality. Power BI is a strong second. Qlik prioritizes exploration over presentation.
Performance with Large Datasets
Power BI performs well with small to medium-sized datasets using Import mode. For larger volumes, DirectQuery mode or aggregation tables are required — adding optimization complexity. It is not the first choice for organizations processing hundreds of millions of rows daily.
Tableau's Hyper in-memory engine is purpose-built for speed at scale. It handles billions of rows efficiently and is the preferred choice for enterprise data teams working with large, frequently refreshing datasets.
Qlik's QIX in-memory engine delivers sub-second response times on associative queries across multi-source data environments — even at significant scale. It is equally optimized for large, complex datasets.
Verdict: Tableau and Qlik both outperform Power BI with large datasets. Power BI is best suited for small to medium workloads.
Pricing
- Desktop Free
- Pro ~$10/mo
- Premium/User ~$20/mo
- Capacity ~$4,995/mo
- Viewer ~$15/mo
- Explorer ~$42/mo
- Creator ~$70/mo
- Tableau+ Custom
- Business ~$30/mo
- Enterprise Custom
- Token-based Available
Verdict: Power BI is the most cost-effective option. Tableau carries the highest total cost of ownership. Qlik sits in the middle tier.
Integration and Ecosystem
Seamlessly integrates with the full Microsoft stack — Excel, Azure, Teams, SharePoint, Dynamics 365, and Microsoft Purview for data governance. For organizations already running on Microsoft infrastructure, Power BI integration is essentially frictionless.
Integrates natively with Salesforce (its parent company), as well as major cloud platforms, databases, and data warehouses. The Tableau-Salesforce combination is particularly powerful for sales and marketing analytics.
Qlik integrates with a wide range of data sources but does not offer the same deep ecosystem benefits as Power BI or Tableau. It compensates with strong data cataloging and lineage capabilities through Qlik Catalog.
Verdict: Power BI wins for Microsoft-centric organizations. Tableau wins for Salesforce-centric teams. Qlik is ecosystem-agnostic.
Advanced Analytics
Includes AI-powered features such as natural language Q&A, smart narratives, anomaly detection, and decomposition trees. DAX enables complex calculated measures and time-intelligence functions. Azure ML integration extends Power BI into predictive territory.
Offers native forecasting, trend lines, clustering, and statistical analysis out of the box. First-class Python (via TabPy) and R integration allows data scientists to embed full statistical models directly within Tableau dashboards — without an engineering handoff.
Qlik's Insight Advisor uses AI to auto-generate relevant charts and surface insights. It supports Python and R extensions, and the associative engine surfaces hidden data patterns that query-based tools often miss entirely.
Verdict: All three tools are capable of advanced analytics. Tableau and Qlik are preferred for organizations with dedicated data science teams or complex modeling requirements.
Real-World Use Cases
- → Financial reporting for mid-size businesses using Microsoft 365
- → Sales performance dashboards connected to Dynamics 365 or Salesforce
- → Operational KPI monitoring embedded in Microsoft Teams or SharePoint
- → Self-service reporting for non-technical business users
- → Customer segmentation and behavior analysis in retail and e-commerce
- → Executive-level data storytelling requiring polished, presentation-ready visuals
- → Forecasting and trend analysis with Python or R models integrated via TabPy
- → Complex multi-metric dashboards for finance, marketing, and healthcare
- → Supply chain optimization across multi-source inventory, logistics, and supplier data
- → Predictive maintenance analytics in manufacturing environments
- → Ad-hoc clinical data exploration in healthcare without IT dependency
- → Dynamic root-cause analysis where analysts explore data without predefined paths
Which Tool Should You Choose?
⚡ Choose Power BI if…
- ✓ Your organization runs on Microsoft 365, Azure, or Dynamics 365
- ✓ Budget is a constraint and cost-effectiveness is a priority
- ✓ You need quick time-to-value with minimal training overhead
- ✓ Most users are non-technical and need self-service reporting
- ✓ Your datasets are small to medium in scale
📊 Choose Tableau if…
- ✓ Visual storytelling and dashboard quality are critical to your use case
- ✓ You manage large, complex enterprise datasets requiring high-performance processing
- ✓ Your team includes data scientists working in Python or R
- ✓ You are a Salesforce customer needing native CRM analytics integration
- ✓ You need the industry's best visualization engine, regardless of cost
🔗 Choose Qlik Sense if…
- ✓ Your analysts need to explore data freely without predefined query structures
- ✓ You are combining data from many disparate, siloed systems
- ✓ Your industry is manufacturing, healthcare, supply chain, or logistics
- ✓ Self-service discovery and root-cause analysis matter more than visual output
- ✓ You need strong data governance and end-to-end data lineage capabilities
Conclusion
Power BI, Tableau, and Qlik are all excellent BI platforms — each with a distinct philosophy, a clear target audience, and genuine strengths. The right choice depends entirely on your organization's data complexity, team capabilities, existing technology stack, and budget.
Power BI is the practical choice for organizations that want fast, affordable, and deeply integrated analytics within the Microsoft ecosystem. Working with an experienced Power BI Developer can help you unlock the full potential of the platform — from DAX modeling to Azure integration and embedded reporting.
Tableau is built for organizations where data visualization and analytical depth are non-negotiable. Partnering with a skilled Tableau Developer ensures your dashboards are not only visually compelling but architected for performance, security, and scalability.
Qlik Sense stands apart with its associative engine — a fundamentally different approach to data exploration that surfaces insights traditional BI tools miss. For industries like manufacturing, healthcare, and supply chain, Qlik Sense Developers can help your organization dynamically connect disparate data sources without predefined query paths — a genuine competitive advantage.
Before making a final decision, run a proof-of-concept on real data from your organization, involve your analysts in the evaluation, and calculate the true total cost of ownership. The right platform will feel obvious once you've seen it work on your data.
