How Our Tableau Dashboards Can Transform Your Business Insights
These demonstrations are a direct reflection of our deep expertise in Tableau development. When you explore the dashboards on this page, you will:
See how we visualize data: We turn raw data into clear, engaging, and actionable insights using Tableau’s powerful visualization capabilities.
Understand our approach: Every dashboard demonstrates how we tailor Tableau solutions to meet specific business needs.
Consider the possibilities: Explore how similar dashboards can resolve challenges in finance, sales, operations, or inventory—precisely the way your business needs.
Built for Professional Success – No Registration Required
We believe in transparency and simplicity. That’s why we don’t ask for sign-ups. Just interact with the dashboards directly and experience firsthand how Iqra Technology can craft custom Tableau dashboards tailored to your enterprise goals.
Ready to Build Your Tableau Dashboard?
Interested in a customized Tableau solution for your business? Contact us to learn how we can help you unlock powerful data insights and drive smarter decisions with Tableau.
Unveiling the Best of Our Tableau Demo: Top Features
Real-Time Insights: Tableau’s live connections let you monitor up-to-date data at any moment.
Interactive Dashboards: Leverage filters, drill-downs, and dynamic layouts to explore data from every angle.
Multi-Source Integration: Seamlessly connect to databases, spreadsheets, web APIs, and cloud services like Salesforce or Snowflake.
Advanced Analytics: Use built-in statistical models and calculated fields to drive predictive insights and uncover patterns.
Top Reasons to Opt for Iqra Technology's Tableau Demo
Hands-On Experience: Explore our dashboards interactively—no static images or templates.
Industry-Specific Use Cases: From sales to operations, see how Tableau adapts to your sector’s analytics needs.
Tailored Demonstrations: Experience how Tableau handles your unique data landscape through personalized, real-time demos.
The Superior Advantages of Tableau for Your Enterprise
Unified Data Integration: Easily bring together data from Excel, SQL, Google Sheets, AWS, and more—all in one place.
Fully Customizable Visuals: Create visually rich dashboards with deep filtering, calculated KPIs, and multi-level hierarchies.
Device Compatibility: Access dashboards anytime, anywhere—Tableau works seamlessly across mobile, tablet, and desktop.
Enterprise-Level Security: Ensure safe access with Tableau’s secure sharing, user-level permissions, and governance controls.
Automated Alerts and Scheduled Reports: Stay informed with data-driven alerts and scheduled dashboard/email distributions—no manual effort required.
Looking to see how Tableau can transform your data into actionable insights? We offer customized Tableau demos to help you explore interactive dashboards, advanced analytics, and real-time reporting tailored to your business needs. Whether you want to visualize KPIs, improve decision-making, or unify data from multiple sources, our experts will guide you through real-world use cases and best practices.
CLIENTS WHO TRUST US
We’ve had the privilege of supporting these clients in achieving their digital goals.
Testimonials
Trusted by Businesses Worldwide
Michael UprightVice President of Foundation Partners,United States
Iqra Technology helped us improve our CRM with customized Salesforce solutions. Their developers understood our workflows and delivered clean, scalable code. They collaborated closely with our internal team and adapted quickly to our evolving needs. Communication was smooth throughout, and deadlines were consistently met. We’re extremely satisfied with their service and highly recommend Iqra Technology to others.
Reece ShelbyManaging Director of Unbroker,Australia
Iqra Technology successfully delivered a quality website, which streamlined the client's operations. The team worked efficiently, delivering reliable services on time without compromising quality. Moreover, they fully understood the requirements, enabling them to deliver exactly what was expected.
Serge Barros ChavesPresident of Datavizx,France
Iqra Technology's developer successfully delivered high-quality dashboards that improved end clients' decision-making. They integrated seamlessly into the client's team and communicated through online meetings. Overall, the client would recommend their IT staff augmentation services.
Tableau is a powerful data visualization and business intelligence tool that helps you analyze, visualize, and understand your data through interactive dashboards and insightful reports.
Tableau provides enterprise-level security with features like row-level security, role-based access control, encrypted connections, and integration with identity providers like Active Directory and SAML.
Businesses of all sizes and industries benefit from Tableau. It’s widely used by analysts, business managers, data teams, and decision-makers who need to interpret data efficiently.
Tableau helps your business by turning data into actionable insights. You can track performance, uncover trends, make data-driven decisions, and visualize KPIs in real time.
Getting started is simple. Contact us with your requirements, and we’ll provide a free consultation. From there, we’ll build custom Tableau dashboards aligned to your business goals.
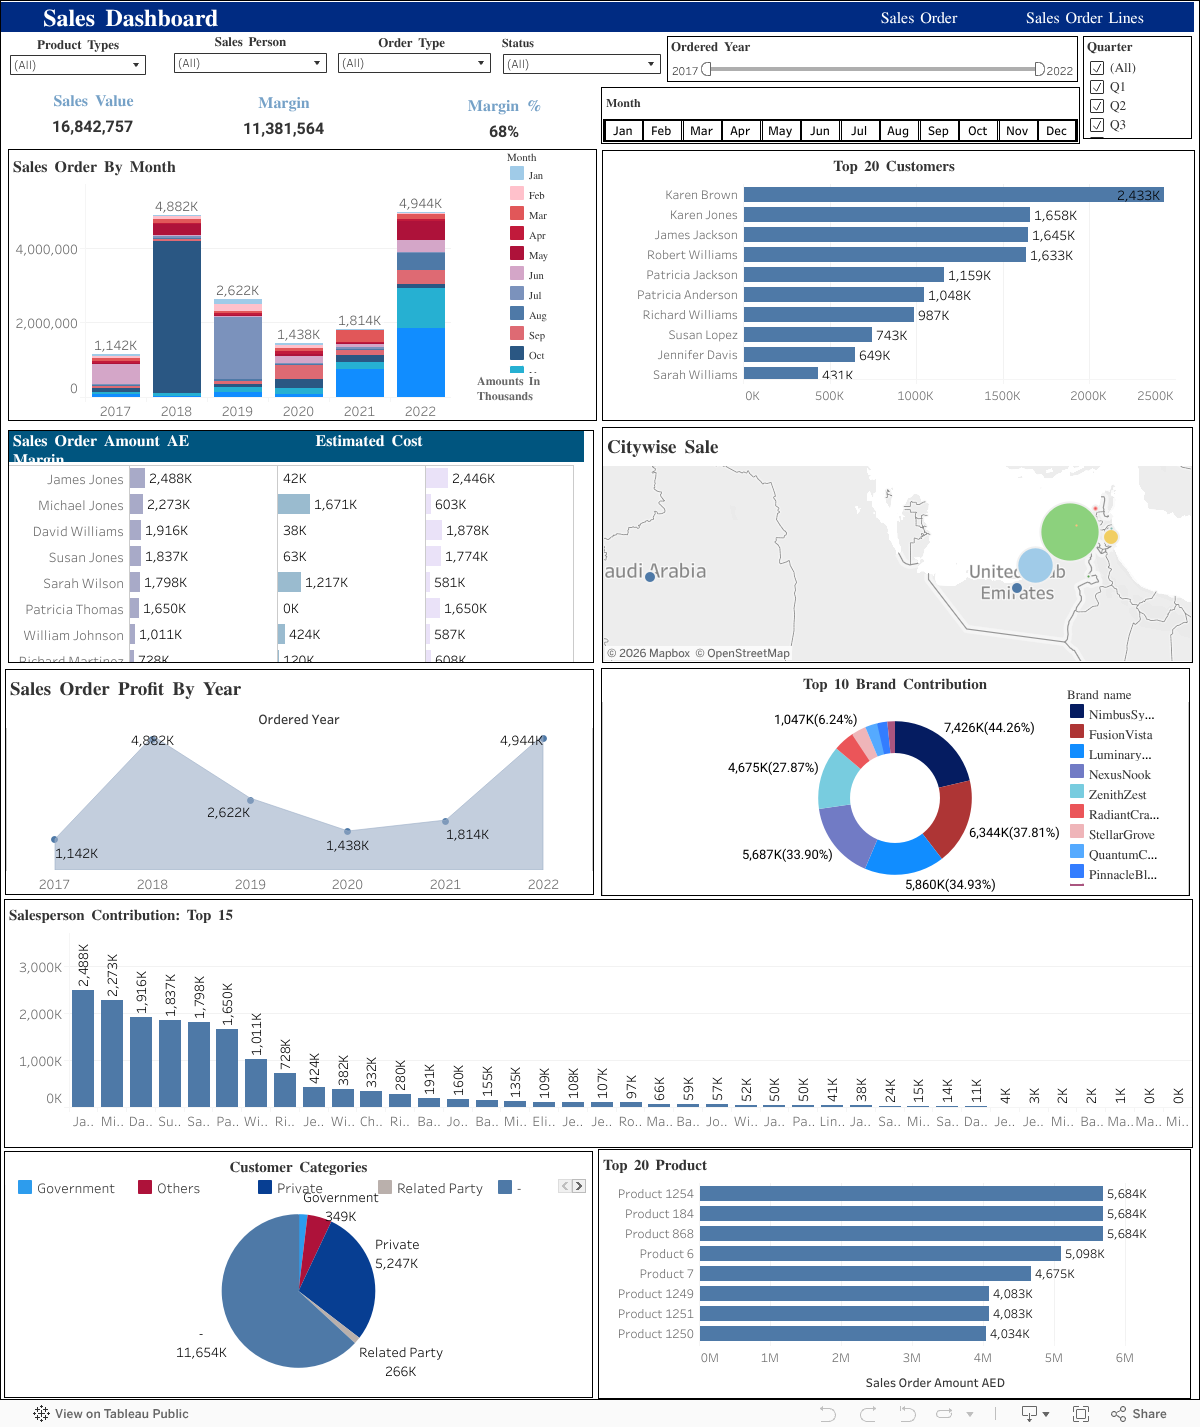
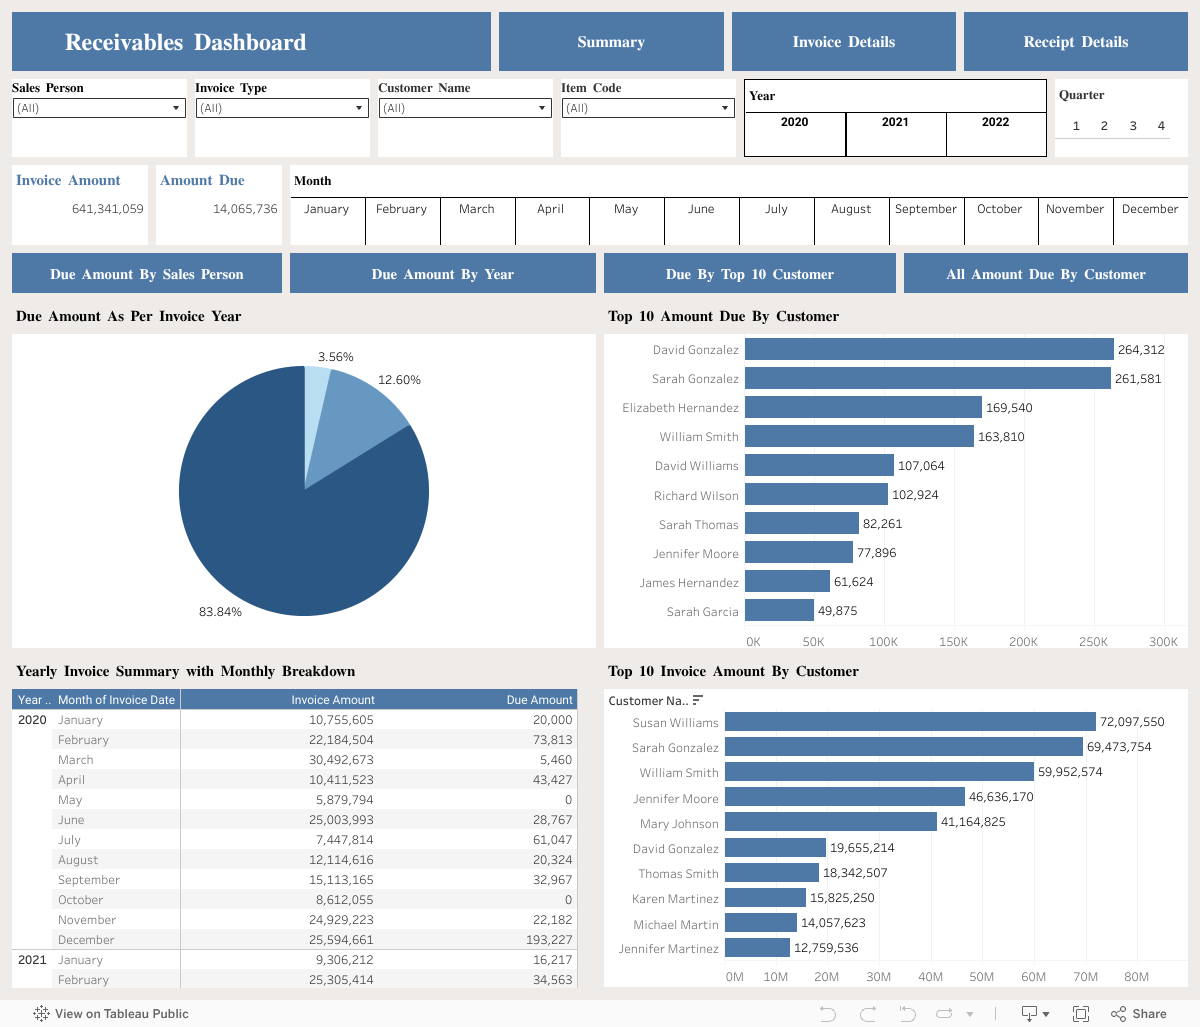
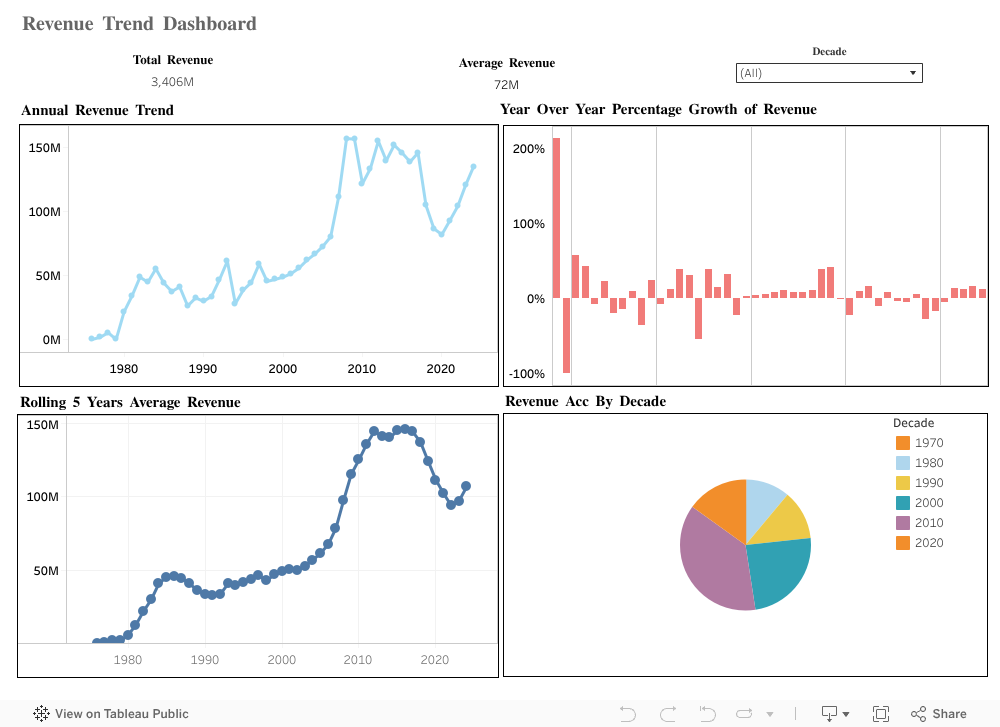
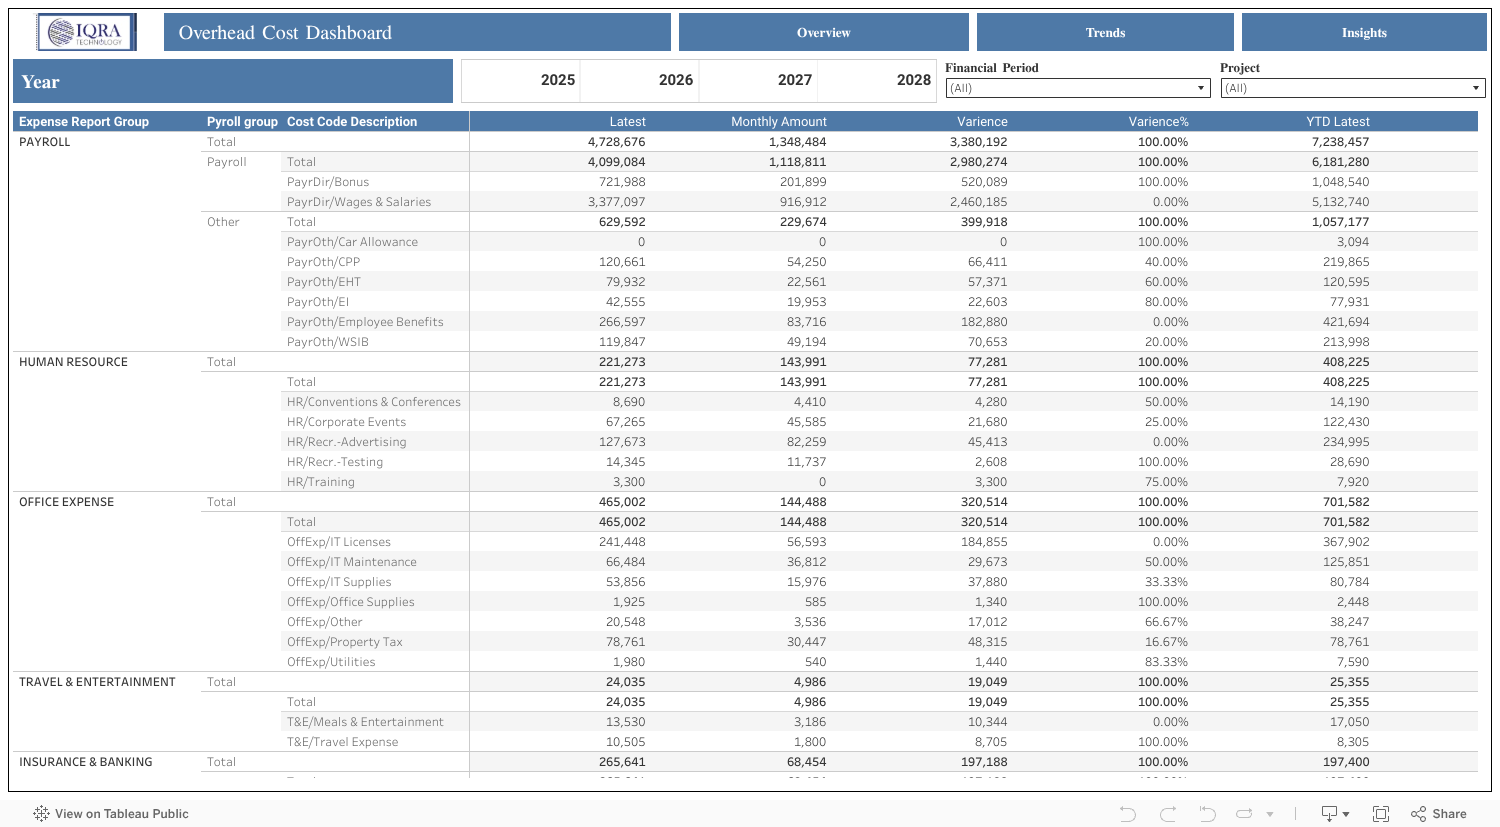
Our Tableau demo showcases real-time, interactive dashboards across domains like finance, sales, inventory, and operations. You’ll experience features like filters, drill-downs, and visual KPIs.
Tableau offers robust security including user authentication, secure data connections, row-level permissions, encryption at rest and in transit, and audit logging.
A Tableau dashboard is a visual workspace that combines multiple charts, graphs, and filters into one interface. It enables users to monitor and explore data interactively.
Yes, all our Tableau dashboards are fully customizable. We tailor them to your business KPIs, data sources, and visual preferences with drill-throughs, calculated fields, and dynamic filters.
Tableau integrates with a wide variety of data sources including Excel, Google Sheets, SQL Server, MySQL, PostgreSQL, Salesforce, Snowflake, AWS, Azure, and more.
Tableau requires minimal setup. Tableau dashboards can be accessed via browser, and Tableau Desktop works on Windows or macOS. For publishing, Tableau Server or Tableau Cloud is used.
Data can be refreshed in real-time or on a schedule. Tableau supports live data connections as well as scheduled extract refreshes depending on your setup and data source.