Financial Dashboard Across Years
Today, we’ll walk through the process of building a Financial Dashboard Across Years using raw data from an Excel spreadsheet.
Step 3: Loading Data into Power BI
Now that your Excel sheet is ready, it’s time to move into Power BI:
• Download Raw Data from here: Financial Dashboard Across Years
• Import Data: Go to Home > Get Data > Excel. Find your file, select it, and then load the Income Statement and Balance Sheet.
• Data Transformation: In some cases, you might need to refine the data further using Power Query inside Power BI. This could involve additional cleaning or restructuring.
Step 4: Establishing Relationships
In Power BI, relationships between tables are crucial:
• Model Your Data: Navigate to the ‘Model’ view and visually set up relationships between tables by connecting related fields (like IDs or category names).
Image 1: Income Statement (IS) Model
Relationships Explained:
1. Join: IS Data ↔ IS Sub Category Join Type: Many-to-One
• Join Type: Many-to-One
• Key: IS Sub Category
• Description: This join connects the IS Data table to the IS Sub Category table using the IS Sub Category field. It allows sorting or grouping of subcategories in IS Data based on the sorting information (IS Cat Sort) available in the IS Sub Category table.
2. Join: IS Data ↔ IS Accounts
• Join Type: Many-to-One
• Key: IS Accounts
• Description: This join links the IS Data table to the IS Accounts table using the IS Accounts field. It facilitates the sorting of account-related data in IS Data using the sort criteria (Acc Sort) provided in the IS Accounts table.
3. Join: IS Data ↔ IS Category
• Join Type: Many-to-One
• Key: IS Category
• Description: This join connects the IS Data table to the IS Category table using the IS Category field. It supports the sorting or categorization of categories in IS Data based on the sorting information (IS Category Sort) provided in the IS Category table.
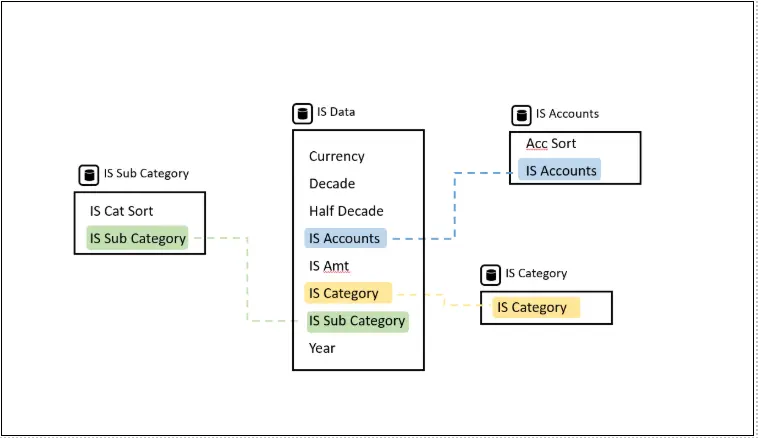
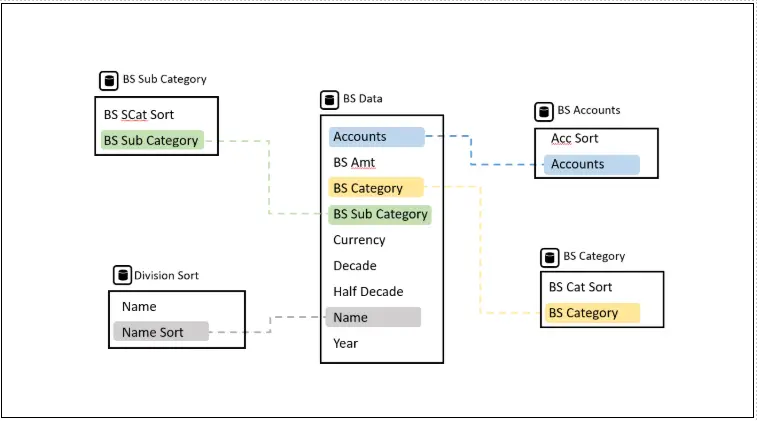
Image 2: Balance Sheet (BS) Model
Relationships Explained:
1. Join: IS Data ↔ IS Sub Category Join Type: Many-to-One
• Join Type: Many-to-One
• Key: BS Sub Category
• Description: This join connects the BS Data table with the BS Sub Category table using the BS Sub Category field. It allows sorting of subcategories in BS Data based on the sort information (BS SCat Sort) provided in the BS Sub Category table.
2. Join: BS Data ↔ BS Accounts
• Join Type: Many-to-One
• Key: Accounts
• Description: This join links the BS Data table to the BS Accounts table via the Accounts field. It enables sorting of account-related data in BS Data based on the sort criteria (Acc Sort) provided in the BS Accounts table.
3. Join: BS Data ↔ BS Category
• Join Type: Many-to-One
• Key: BS Category
• Description: This join links the BS Data table with the BS Category table using the BS Category field. It facilitates the sorting or categorization of categories in BS Data based on the BS Cat Sort field in the BS Category table.
4. Join: BS Data ↔ Division Sort
• Join Type: Many-to-One
• Key: Name
• Description: This join connects the BS Data table with the Division Sort table using the Name field. It allows for sorting of divisions in the BS Data table based on the sort information (Name Sort) from the Division Sort table.
Sorting Configuration:
• Both the BS Category and BS Sub Category tables are sorted by respective sort tables (BS Cat Sort and BS Scat Sort). This sorting ensures that categories and subcategories are presented in a predefined order in reports, making the data presentation consistent and logical.
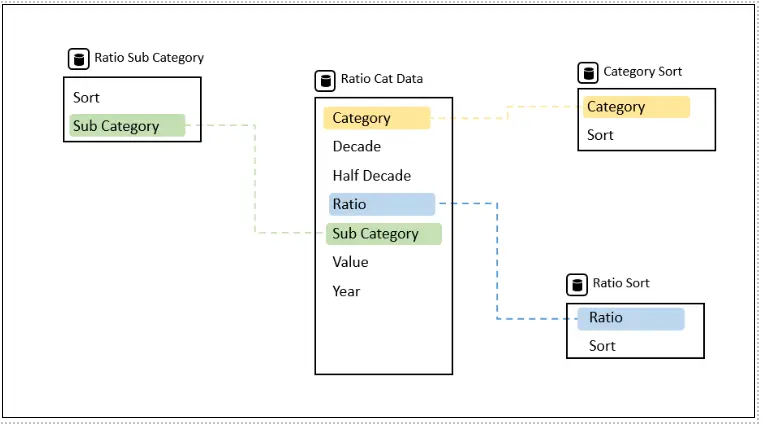
Image 3: Ratio Model
Relationships Explained:
1. Join: Ratio Cat Data ↔ Ratio Sub Category
• Join Type: Many-to-One
• Key: Sub Category
• Description:This join connects the Ratio Cat Data table with the Ratio Sub Category table using the Sub Category field. It allows sorting or categorization of subcategories in Ratio Cat Data based on the sorting information (Sort) provided in the Ratio Sub Category table.
2. Join: Ratio Cat Data ↔ Category Sort
• Join Type: Many-to-One
• Key: Category
• Description:This join links the Ratio Cat Data table to the Category Sort table using the Category field. It enables sorting of categories in Ratio Cat Data based on the sorting order defined in the Category Sort table.
3. Join: Ratio Cat Data ↔ Ratio Sort
• Join Type: Many-to-One
• Key: Ratio
• Description:This join connects the Ratio Cat Data table with the Ratio Sort table using the Ratio field. It allows sorting or ranking of ratio data in Ratio Cat Data based on the sorting criteria provided in the Ratio Sort table.
Step 5: Building the Dashboard
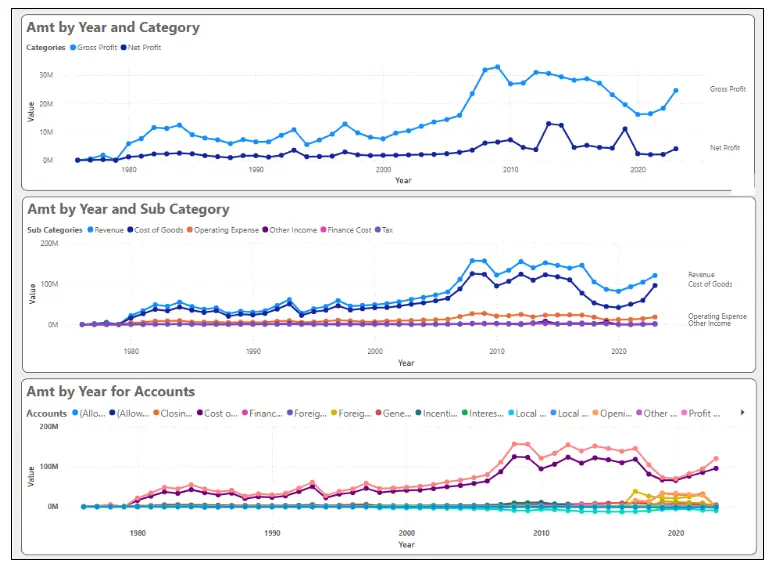
1) First Report will be an Income Statement of Profit and Loss with a Matrix and Line chart.
For this matrix you will need free third party app:
• Download: Financial Reporting Matrix by Profitbase
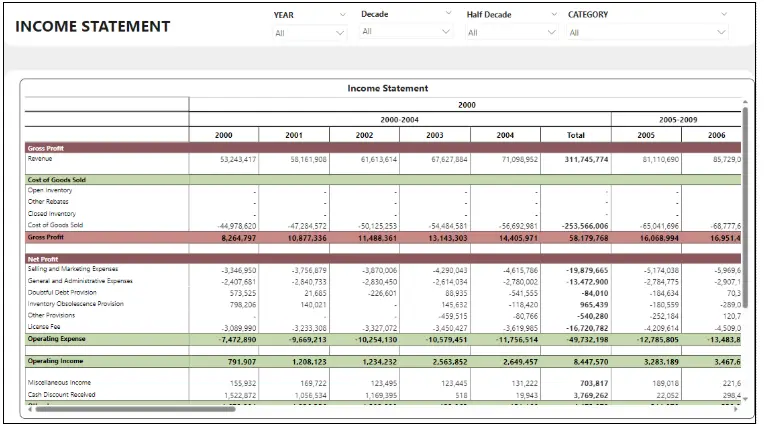
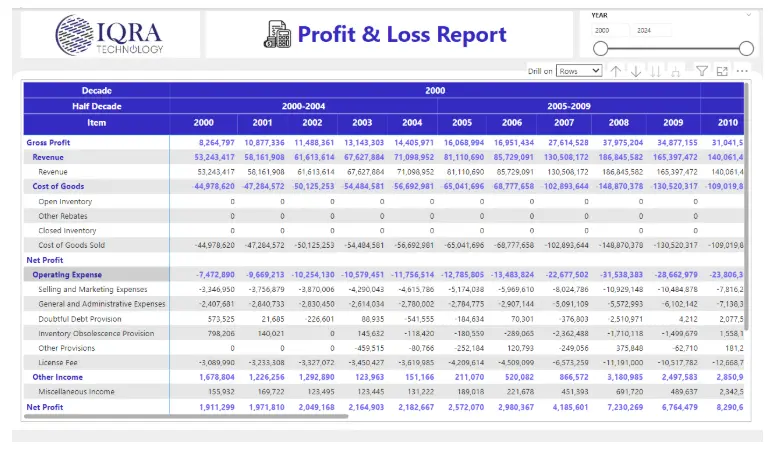
2) Second Report will be on Profit and Loss in the Matrix Table
• Dax Query for Matrix value:
P&L Calculation =
VAR IsNetProfit = SELECTEDVALUE(‘IS Data'[IS Category]) = “Net Profit”
VAR DetailLevel = HASONEVALUE(‘IS Data'[IS Accounts])
VAR HasSubCategoryDetail = HASONEVALUE(‘IS Data'[IS Sub Category])
VAR GeneralSum = IF(
HASONEVALUE(‘IS Data'[IS Accounts]),
SUM(‘IS Data'[IS Amt]),
CALCULATE(
SUM(‘IS Data'[IS Amt]),
FILTER(
ALL(‘IS Data'[IS Accounts]),
NOT ‘IS Data'[IS Accounts] IN {“Open Inventory”, “Closed Inventory”, “Other Rebates”}
)
)
)
RETURN
IF(
IsNetProfit && NOT DetailLevel && NOT HasSubCategoryDetail,
BLANK(),
GeneralSum
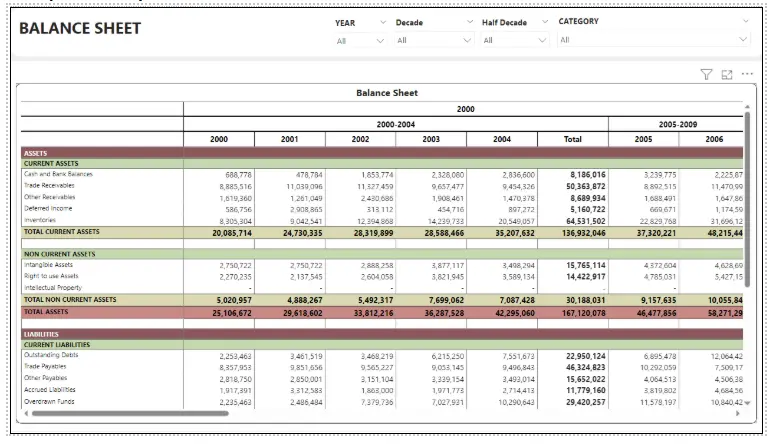
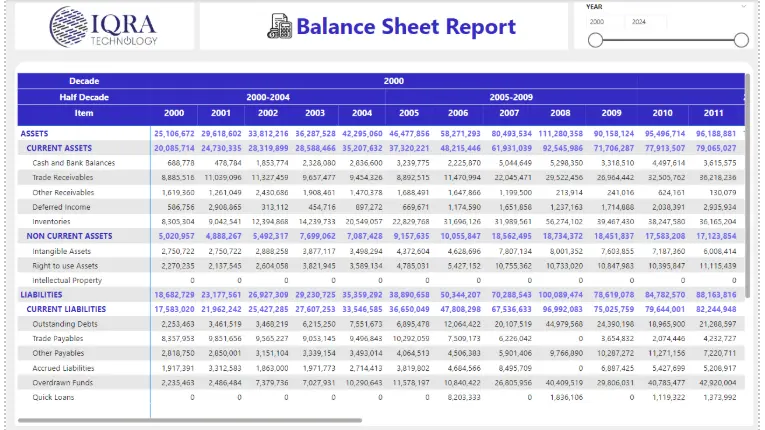
1) Third Report will be a Balance Sheet with a Matrix and Line Chart
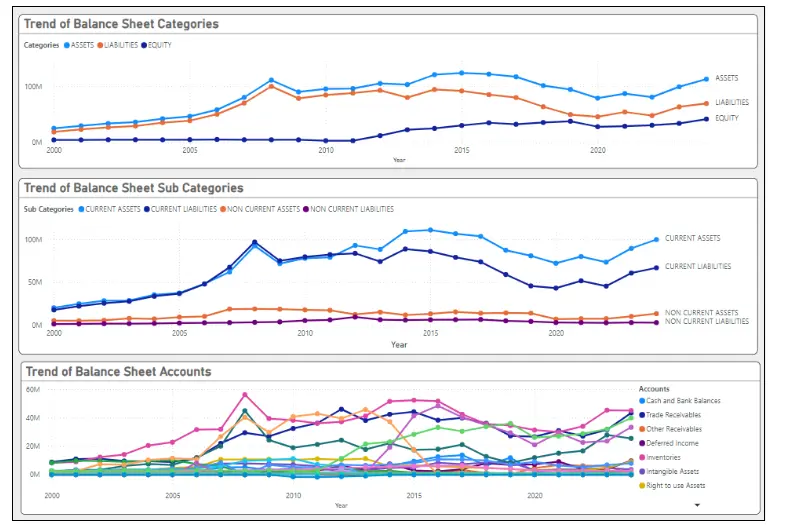
2) Fourth Report will be on Balance Sheet in Matrix Table
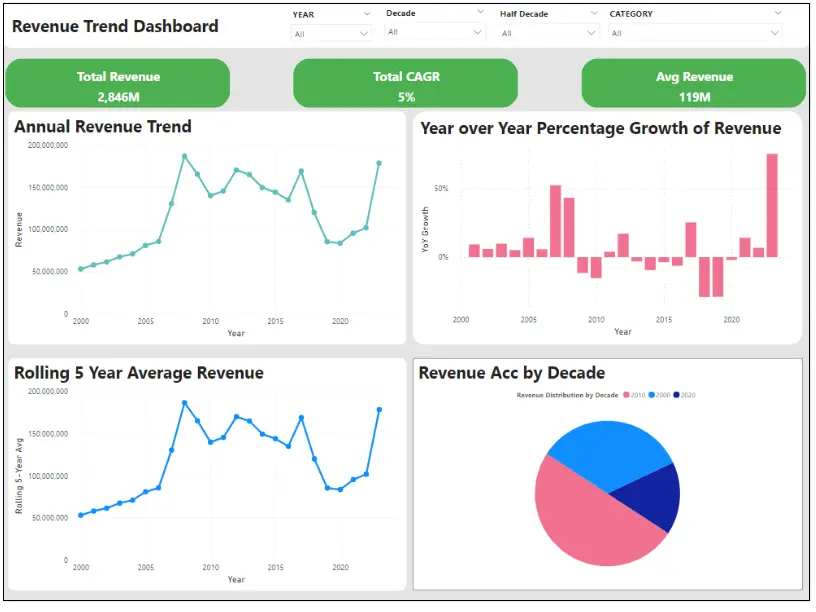
3) Fifth Report will be on Revenue Trend Dashboard
• Dax Queries for KPI’s and charts:
Total CAGR =
VAR NonZeroYears = FILTER(ALL(‘IS Data’), [Revenue] <> 0)
VAR StartYear = MINX(NonZeroYears, ‘IS Data'[Year])
VAR EndYear = MAXX(NonZeroYears, ‘IS Data'[Year])
VAR StartValue = CALCULATE(
[Revenue],
‘IS Data'[Year] = StartYear
)
VAR EndValue = CALCULATE(
[Revenue],
‘IS Data'[Year] = EndYear
)
VAR NumYears = EndYear – StartYear
RETURN
IF(
StartValue = 0 || EndValue = 0 || NumYears = 0,
BLANK(),
POWER((EndValue / StartValue), 1 / NumYears) – 1
)
Avg Revenue = AVERAGEX(
VALUES(‘IS Data'[Year]),
[Revenue]
)
YoY Growth =
VAR CurrentYear = MAX(‘IS Data'[Year])
VAR CurrentYearRev = CALCULATE([Revenue], ‘IS Data'[Year] = CurrentYear)
VAR PreviousYearRev = CALCULATE([Revenue], ‘IS Data'[Year] = CurrentYear – 1)
RETURN
IF(
AND(NOT(ISBLANK(CurrentYearRev)), NOT(ISBLANK(PreviousYearRev))),
DIVIDE(CurrentYearRev – PreviousYearRev, PreviousYearRev),
BLANK()
)
Rolling 5-Year Avg =
AVERAGEX(
FILTER(
ALL(‘IS Data'[Year]),
‘IS Data'[Year] <= MAX(‘IS Data'[Year]) &&
‘IS Data'[Year] > MAX(‘IS Data'[Year]) – 5
),
[Revenue]
)
4) Sixth Report will be on Ratio Analysis in Matrix Table
• Dax Queries for Matrix Value:
Selected Ratio Value =
VAR SelectedRatio = SELECTEDVALUE(‘Ratio Cat Data'[Ratio])
VAR RetrievedValue =
CALCULATE(
MAX(‘Ratio Cat Data'[Value]),
‘Ratio Cat Data'[Ratio] = SelectedRatio
)
RETURN
SWITCH(
TRUE(),
— Whole Number Format (Days Ratios)
SelectedRatio IN {
“Account Receivables Days”,
“Inventory Turnover Days”,
“Account Payable Days”,
“Cash Conversion Cycle Days”
}, FORMAT(RetrievedValue, “0”),
— Percentage Format (All Other Ratios)
NOT(ISBLANK(SelectedRatio)), FORMAT(RetrievedValue, “0%”),
— Default Case
BLANK()
)
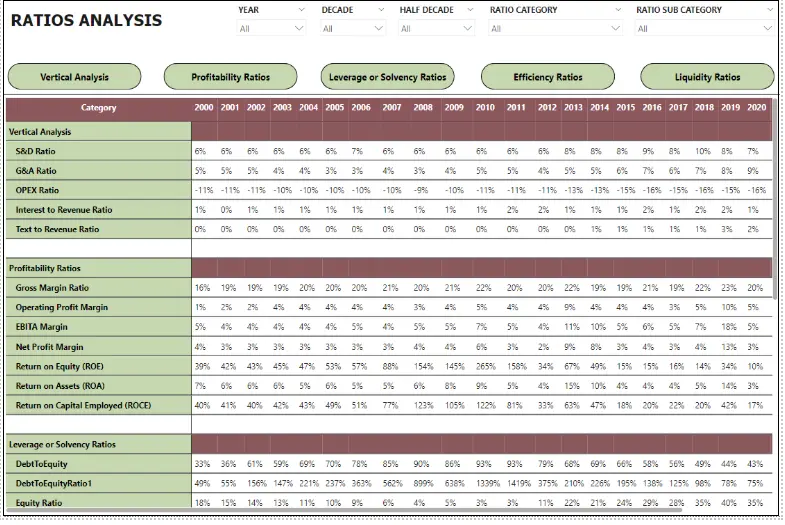
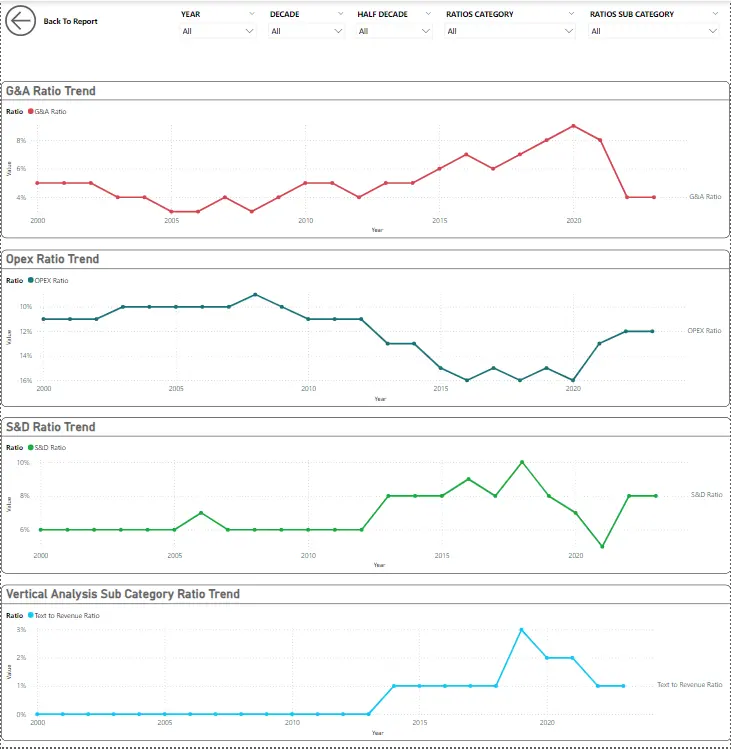
We can Navigate to other Reports in Ratio Analysis through buttons in Ratio Analysis Reports
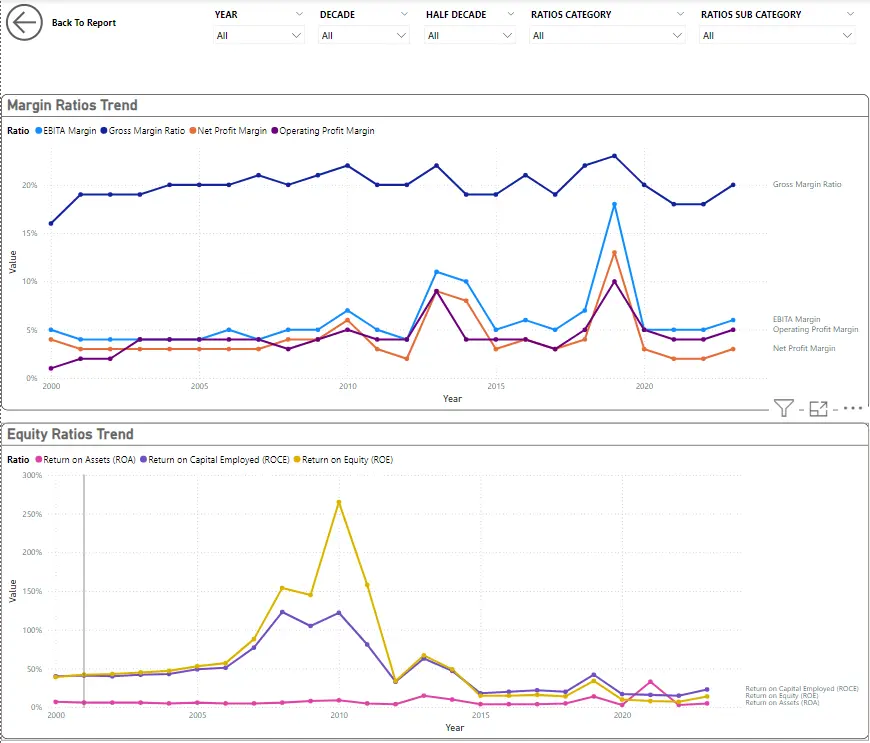
• Vertical Analysis Line Chart report:
• Profitability Ratios Line Chart
• Leverage & solvency Ratios Line Chart
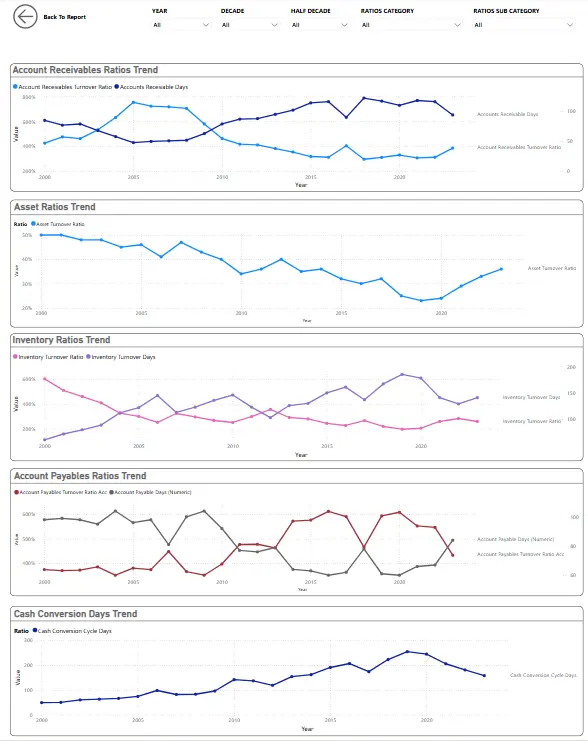
• Efficiency Ratios Line Chart
Dax Queries:
Account Payable Days =
VAR RatioValue = MAX(‘Ratio Cat Data'[Value]) — Ensure only one value is selected
VAR SelectedRatio = SELECTEDVALUE(‘Ratio Cat Data'[Ratio], “Account Payable Days”) — Ensure only one ratio is selected
RETURN
SWITCH(
TRUE(),
SelectedRatio IN {
“Account Receivables Days”,
“Inventory Turnover Days”,
“Account Payable Days”,
“Cash Conversion Cycle Days”
},
RatioValue,
)
Account Payables Turnover Ratio Acc = CALCULATE(‘Ratio Cat Data'[Ratio Value ($)],’Ratio Cat Data'[Ratio] IN {“Account Payable Turnover Ratio”})
Account Receivables Turnover Ratio Acc = CALCULATE(‘Ratio Cat Data'[Ratio Value ($)],’Ratio Cat Data'[Ratio] IN {“Account Receivables Turnover Ratio”})
Accounts Receivable Days Acc = CALCULATE(‘Ratio Cat Data'[Ratio Value ($)],’Ratio Cat Data'[Ratio] IN {“Account Receivables Days”})
Cash Conversion Cycle Days =
VAR RatioValue = MAX(‘Ratio Cat Data'[Value])
VAR SelectedRatio = SELECTEDVALUE(‘Ratio Cat Data'[Ratio], “Cash Conversion Cycle Days”)
RETURN
SWITCH(
TRUE(),
SelectedRatio IN {
“Account Receivables Days”,
“Inventory Turnover Days”,
“Account Payable Days”,
“Cash Conversion Cycle Days”
},
RatioValue,
)
Inventory Turnover Days =
VAR RatioValue = MAX(‘Ratio Cat Data'[Value]) — Ensure only one value is selected
VAR SelectedRatio = SELECTEDVALUE(‘Ratio Cat Data'[Ratio], “Inventory Turnover Days”) — Ensure only one ratio is selected
RETURN
SWITCH(
TRUE(),
SelectedRatio IN {
“Account Receivables Days”,
“Inventory Turnover Days”,
“Account Payable Days”,
“Cash Conversion Cycle Days”
},
RatioValue, — Return the numeric value directly
0 — Default value if no valid ratio is selected
)
Inventory Turnover Ratio Acc = CALCULATE(‘Ratio Cat Data'[Ratio Value ($)],’Ratio Cat Data'[Ratio] IN {“Inventory Turnover Ratio”})
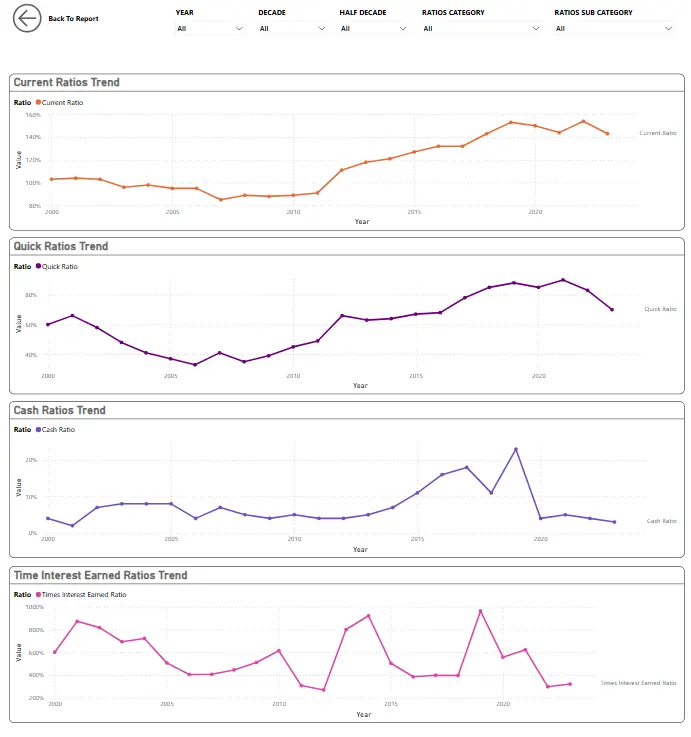
• Liquidity Ratios Line Chart
Step 5: Building the Dashboard
Finally, make your dashboard user-friendly and visually appealing:
This step-by-step guide should help you transform raw Excel data into a dynamic Power BI dashboard. Remember, practice is key, so the more dashboards you create, the more proficient you’ll become.


