

In this section, you’ll learn how to turn raw data into an interactive Sales Pipeline Dashboard. Connect Power BI to your data source, download this Excel Sales Pipeline Dataset
Sales Pipeline Dashboard
A Sales Pipeline Dashboard is an essential tool for tracking, analyzing, and managing sales activities. It provides actionable insights into the health of the sales pipeline, including opportunity stages, forecast adjustments, revenue trends, and territory performance. By visualizing this data, sales teams can make informed decisions, identify bottlenecks, and optimize their workflows to achieve better conversion rates and revenue growth.
This dashboard is built on ten data tables, including a custom table created using DAX code for dynamic forecasting. It integrates critical data points, enabling real-time updates and seamless analysis.
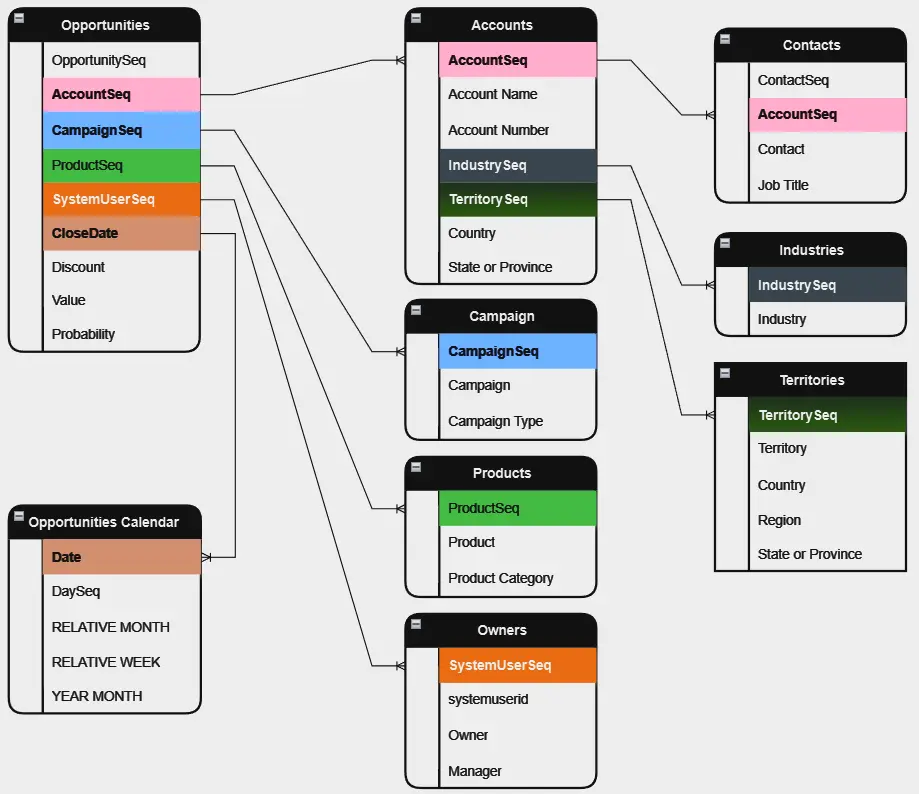
Understand Tables of your data set, we have Ten tables in data set:
Data Tables
The Sales Pipeline Dashboard is based on the following data tables:
Contacts:
The Contacts table holds the details of individuals within accounts. It includes contact details like phone number, email, and address, and links these to related accounts for easy communication tracking.
Key Columns: ContactSeq (Primary Key), AccountSeq (Foreign Key), Contact Name, Phone, Email, Address
Campaign:
The Campaign table stores data about marketing campaigns. It includes information about campaign budgets, durations, and performance metrics.
Key Columns: CampaignSeq (Primary Key), Campaign Name, Budget, Start Date, End Date
Products:
The Products table catalogs the products or services offered by the business. It helps track pricing, availability, and other product details.
Key Columns: ProductsSeq (Primary Key), Product Name, Product Price, Product Category
Opportunities:
The Opportunities table tracks potential sales or business opportunities with clients. It helps manage sales stages and revenue forecasts.
Key Columns: OpportunitySeq (Primary Key), AccountSeq (Foreign Key), ProductsSeq (Foreign Key), SystemUserSeq (Foreign Key), CampaignSeq (Foreign Key), CloseDate
Owners:
The Owners table represents sales representatives or system users. It contains information about team members involved in sales activities.
Key Columns: SystemUserSeq (Primary Key), Owner Name, Email, Role
Opportunities Calendar:
The Opportunities Calendar table provides a timeline view of opportunities, aiding in deadline tracking and planning.
Key Columns: Date (Primary Key), OpportunitySeq (Foreign Key)
Industries:
The Industries table categorizes business industries. It links accounts to their respective industry types.
Key Columns: IndustrySeq (Primary Key), Industry Name
Territories:
The Territories table defines geographic regions for sales activities. It helps in analyzing regional performance.
Key Columns: TerritorySeq (Primary Key), Territory Name, Region
Opportunity Forecast Adjustment (Custom Table)
This custom table is created using DAX code and allows dynamic adjustment of sales forecasts based on business needs.
Key Columns: Adjustment ID (Auto-generated), Forecast Adjustment Values
Data Relationships
The following relationships define how the tables are connected:
Opportunity to Accounts:
Join Type: Many-to-One
Key: AccountSeq
Description: Tracks the relationship between opportunities and their associated accounts.
Accounts to Contacts:
Join Type: Many-to-One
Key: AccountSeq
Description: Links accounts to their respective contacts.
Accounts to Industries:
Join Type: Many-to-One
Key: IndustrySeq
Description: Defines the relationship between accounts and industries.
Accounts to Territories:
Join Type: Many-to-One
Key: TerritorySeq
Description: Connects accounts with their geographic territories.
Opportunity to Campaign:
Join Type: Many-to-One
Key: CampaignSeq
Description: Tracks opportunities generated through specific marketing campaigns.
Opportunity to Products:
Join Type: Many-to-One
Key: ProductsSeq
Description: Links opportunities to the products or services they involve.
Opportunity to Owners:
Join Type: Many-to-One
Key: SystemUserSeq
Description: Assigns opportunities to specific sales representatives or system users.
Opportunity to Opportunity Calendar:
Join Type: Many-to-One
Key: Close Date -Date
Description: Assigns opportunities to specific sales representatives or system users.
Here in this file you’ll get all the DAX formulae used to create calculated columns in this Sales Pipeline Dashboard. Click the link below to download the file.
Visualization
Design visualizations to present key insights using charts, tables, and maps. Click the link below to explore this dashboard in our demo dashboards.
Sales Pipeline Dashboard
1. Overview

2. Win/Loss Ratio Overview

3. Industries Overview

4. Pipeline Trends

5. Trend Analytics

6. Win/Loss Ratio Insights

7. Days to Close Insights

8. Sales Discounting Insights

9. Revenue Source Breakdown

