

Getting Started with Power BI Desktop
Creating your first project, understanding the Power BI interface, and exploring basic functionalities
Creating Your First Project in Power BI
In this section, you’ll learn how to create your first Power BI project, understand the interface, and explore some basic functionalities to help you get started with data visualization and analysis. To start your first project in Power BI, follow these simple steps to connect to data, create visualizations, and build a meaningful report.
Click the link below, an excel file will open in your browser, click file section, click Download then Microsoft Excel to download the Countries Population dataset. Countries Population
Step 1: Get data and Connect with Power BI
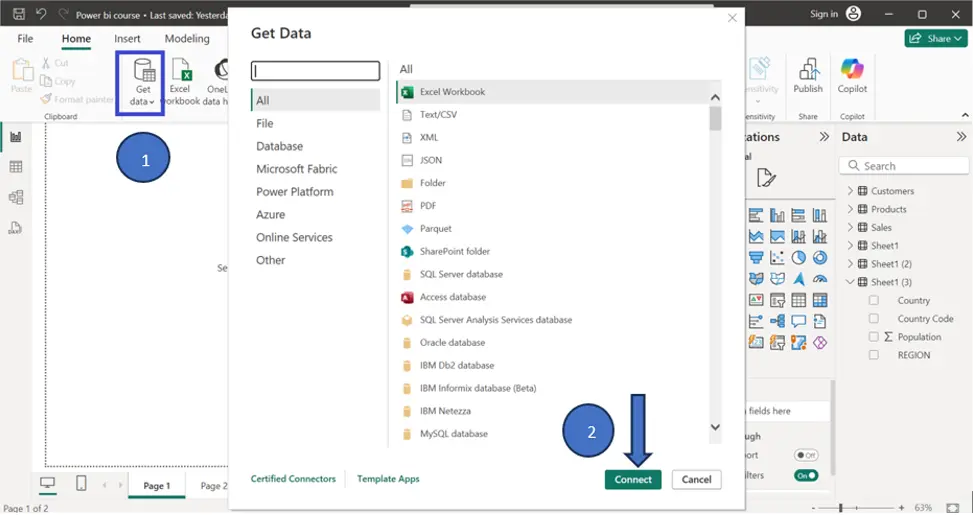
1. Open Power BI Desktop from your computer. On the home screen, click on “Get data” from the Home ribbon.
2. A dialog box will appear with multiple data source options. Select a data source (e.g., Excel), and click Connect.
3. Choose your file, and click Open.
Step 2: Load and Prepare Data
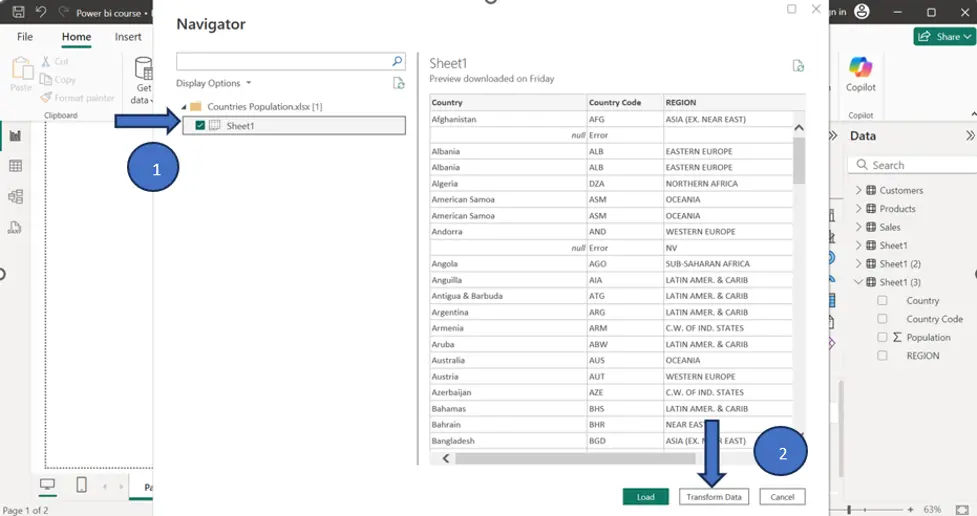
1. The Navigator window will display available tables or sheets from your selected data source. Select the tables you need
2. Click Load to import data or Transform Data to open the Power Query Editor for cleaning.
Step 3: Clean and Transform Data
• In the Power Query Editor, perform various data preparation tasks:
1. Use the first row as header.
2. Remove unnecessary rows or columns, select the row with errors and click Remove rows then select Remove errors.
• once done, click close & apply to load the transformed data
And here we can see that how we can clean and transform our data using power BI power query editor:
Step 4: Create Visualizations
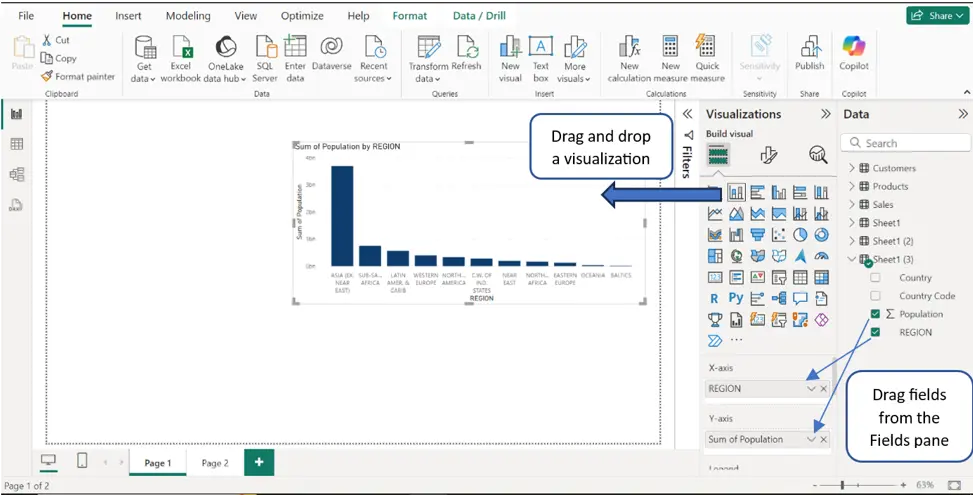
1. In the Report View, Drag and drop a visualization (e.g., bar chart, line chart) from the Visualizations pane.
2. Drag fields from the Fields pane to the visualization’s fields (e.g., Values, Axis).
Step 5: Save Your Report
• Click File > Save As to save your Power BI project with a .pbix extension.
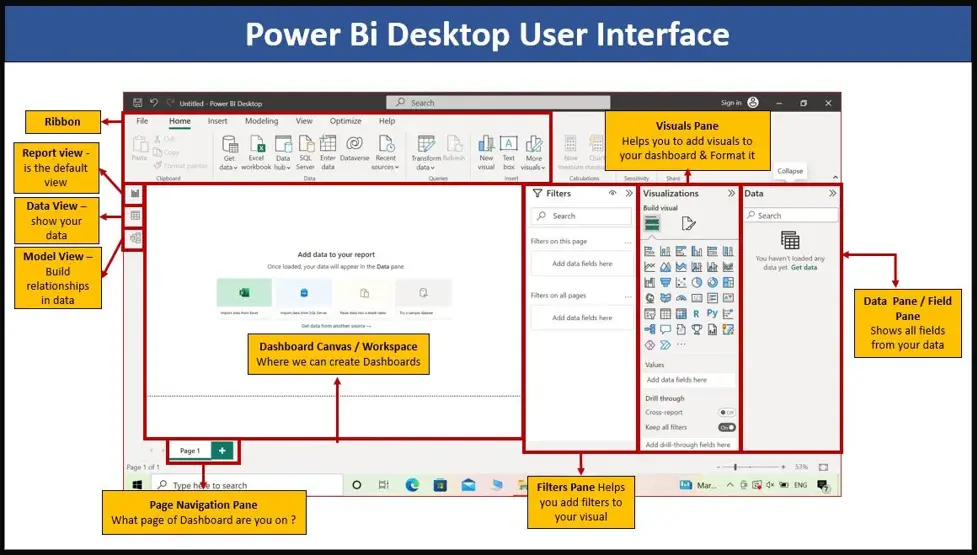
Understanding the Power BI Interface
1. Home Ribbon: Contains options for importing data, saving your project, and publishing reports.
2. Report View: The main canvas where you design and build your visual reports.
3. Data View: Displays your raw data in table format, allowing you to examine and edit it directly.
4. Model View: Provides a visual representation of the data model, where you can manage relationships between different tables.
5. Fields Pane: Lists all the tables and columns that have been loaded into your project.
6. Visualizations Pane: Contains different chart types and visual elements that you can add to your report.
7. Filters Pane: Allows you to apply filters to your data to control what is shown in your visualizations.
Course Video
Yes, Power BI Desktop is relatively easy to learn, especially for those familiar with Excel or data analysis. Its user-friendly interface simplifies the process.
1. Download and install Power BI Desktop.
2. Connect to a data source.
3. Clean and transform data using Power Query.
4. Create visuals and dashboards.
5. Publish to Power BI Service.
Yes, you can self-learn Power BI through online tutorials, Microsoft documentation, and practice. Free resources and training videos are widely available.
Power BI Desktop is used to connect, clean, model, and visualize data. It helps create interactive reports and dashboards for data-driven decision-making.
Start with online tutorials, focus on data modeling and visualization basics, explore Power Query and DAX functions, and practice by building sample dashboards.
Power BI Desktop connects to data sources, allows data transformation, and enables users to build interactive visualizations and reports that can be shared online.
Excel is not required but can complement Power BI. Many Power BI users import Excel data for analysis and visualization.
SQL is not mandatory, but it is helpful for working with databases and writing queries to retrieve or prepare data for analysis.
No, coding is not required for basic tasks. However, learning DAX (Data Analysis Expressions) and Power Query M language can enhance data modeling capabilities.
You can download Power BI Desktop from the Power BI Desktop download page or the Power BI service.
