

DAX - Data Analysis Expressions
Introduction to DAX, writing simple and complex formulas, and using DAX for calculations
In this section of our Power BI course! we’ll introduce you to DAX (Data Analysis Expressions), explain how to write simple and complex formulas, and show you how to use DAX for calculations.
What is DAX?
DAX is a formula language used in Power BI to create custom calculations and data analysis. Think of DAX as similar to Excel formulas, but much more powerful and designed specifically for working with data models in Power BI.
• Why use DAX? DAX allows you to create new data fields, calculate values, and analyze data in ways that are not possible with standard Power BI tools.
• Calculated Columns: You can use DAX to create new columns in your data.
Example: To create a “Full Name” column that combines “First Name” and “Last Name,”.
Full Name = [First Name] & ” ” & [Last Name]
This formula uses the & operator to combine text fields.
• Measure: A Measure is a calculation in Power BI that gives you important numbers based on your data. It helps you perform calculations like totals, averages, or percentages. Measures automatically update whenever your data changes, making them very useful for real-time reports.
Writing Simple DAX Formulas
Let’s start with a few simple DAX formulas you can use in Power BI.
1. You can create these formulas by clicking New Measure under the Home tab in Power BI.
2. Write the DAX formula (e.g., SUM, AVERAGE)
SUM: Adds up all the values in a column.
Example: Total Sales = SUM(Sales[SalesAmount])
This formula will add up all the values in the Amount column of the Sales table to calculate the total sales.
3. Drag a table in Report view and Drag the Measure and other fields in field’s pane.


• AVERAGE: Calculates the average value of a column.
Example: Average Sales = AVERAGE(Sales[SalesAmount])
This formula finds the average sales amount.
• COUNT: Counts the number of rows or values in a column.
Example: Count of Products = COUNT(Products[ProductID])
This formula counts the number of products in the ProductID column of the Products table.
• MIN / MAX: Finds the minimum or maximum value in a column.
Example: Min Sales = MIN(Sales[SalesAmount])
This formula finds the smallest sales amount.
Example: Max Sales = MAX(Sales[SalesAmount])
This formula finds the highest sales amount.
Writing Complex DAX Formulas
Now, let’s look at more complex DAX formulas that can perform deeper analysis.
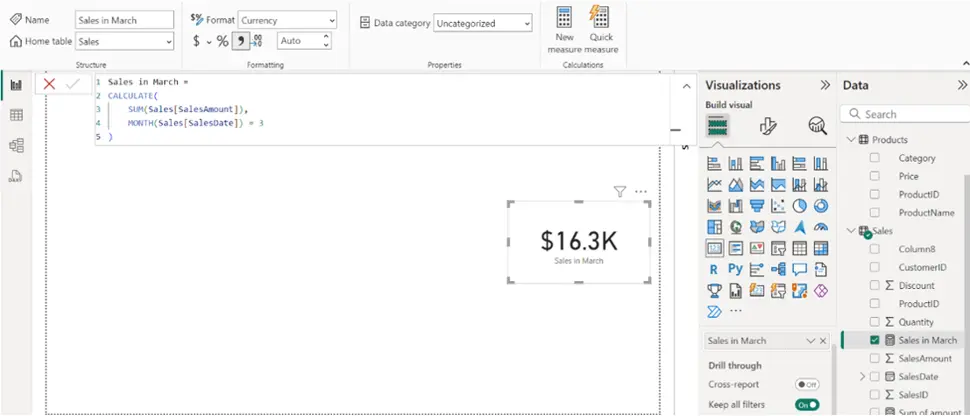
• CALCULATE: Changes the context of a calculation. You can apply filters to calculations using this function.
Example: Total Sales for 2023 = CALCULATE(SUM(Sales[SalesAmount]),
MONTH(Sales[SalesDate] )=3)
This formula calculates the total sales for the March.
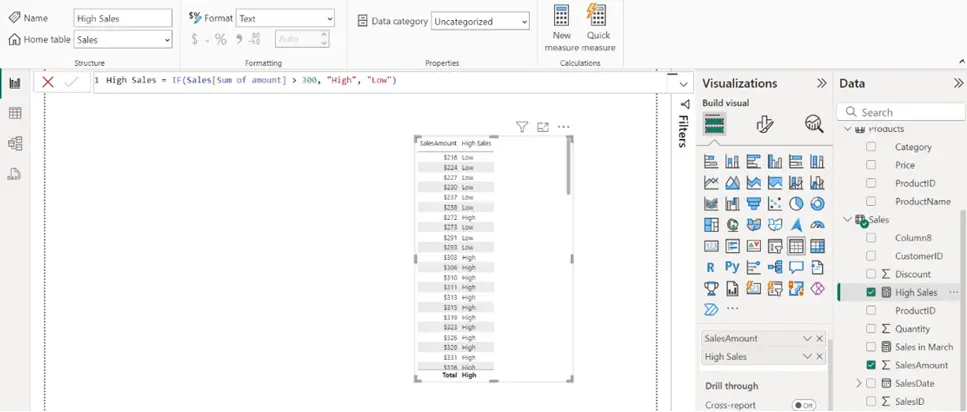
• IF: Performs logical tests and returns values based on the test.
Example: High Sales = IF(Sales[SalesAmount] > 300, “High”, “Low”)
This formula checks if the sales amount is greater than 300. If it is, it returns “High”; otherwise, it returns “Low.”
• DATEADD: Shifts dates by a specific number of intervals (e.g., days, months, years).
Example: Sales Last Month= CALCULATE(SUM(Sales[SalesAmount]),
DATEADD(Sales[SalesDate], -1, Month))
This formula calculates last year’s sales by moving the date back by one month.

• DIVIDE: Performs division and handles divide-by-zero errors.
Example: Sales per Product = DIVIDE(SUM(Sales[SalesAmount]),
COUNT(Products[ProductID]), 0)
This formula calculates the sales per product, and if there is a divide-by-zero error, it returns 0.
Using DAX for Advance Calculations
DAX is powerful for performing calculations in your reports. Let’s look at a few scenarios where DAX can be used for advanced calculations.
• Filter: The FILTER function in DAX allows you to apply filters to your data.
Total Sales for North Region = CALCULATE( SUM(Sales[SalesAmount]),
FILTER(Customers, Customers[Region] = “North”) )
You have a table called Sales with columns for SalesAmount and Region. You want to calculate the total sales only for the “North” region.

• Year-to-Date (YTD) Sales:
Example: YTD Sales = TOTALYTD(SUM(Sales[SalesAmount]), Sales[SalesDate])
This formula calculates the year-to-date sales based on the current date.

• Percentage of Total:
Example: Percent of Total Sales = DIVIDE(SUM(Sales[Amount]),
CALCULATE(SUM(Sales[Amount]), ALL(Sales)))
This formula calculates the percentage of total sales for each individual sales. Add Product Id field so it will give product wise sales percentage.

• Important DAX Functions Cheat Sheet
Here’s a quick reference list of some of the most important DAX functions you should know:
Course Video
YouTube Reference :
DAX is used in Power BI, Excel, and SQL Server Analysis Services to create calculated columns, measures, and custom tables for data modeling and analysis. It helps perform calculations and data manipulation.
A DAX expression is a formula written in DAX to perform calculations or define custom aggregations. For example, SUM(Sales[Amount]) sums up the values in the “Amount” column.
A DAX formula is a calculation or expression used in Power BI or Excel. It consists of functions, operators, and references, like CALCULATE(SUM(Sales[Amount]), Sales[Region] = “East”).
DAX is used for advanced calculations, aggregations, and creating dynamic reports. For example, it’s used to calculate year-over-year growth, rolling averages, or custom KPI measures.
Advanced DAX techniques include:
1. Using CALCULATE for context modification.
2. Time intelligence functions (e.g., DATEADD, TOTALYTD).
3. Creating dynamic measures with conditional logic (IF, SWITCH).
4. Optimizing performance with calculated tables and variables.
