

Oracle EBS Reporting with Power BI
A complete technical guide to connecting Oracle E-Business Suite with Microsoft Power BI — covering architecture, SQL views, data modeling, DAX, and 7 live dashboard demos.
What is Oracle EBS (E-Business Suite)?
Oracle E-Business Suite (EBS) is an enterprise-level ERP (Enterprise Resource Planning) system developed by Oracle Corporation. It helps organizations manage their core business processes on a single integrated platform.
It includes the following key modules:
- Finance (GL, AP, AR) — General Ledger, Accounts Payable, Accounts Receivable
- Supply Chain (PO, INV, OM) — Purchase Orders, Inventory, Order Management
- HRMS — Human Resources & Payroll
- Manufacturing (WIP, BOM) — Work in Process, Bill of Materials
- Projects (PA) — Project Accounting
Oracle EBS runs on an Oracle Database backend (typically Oracle 12c or 19c). All data is stored in Oracle tables:
- Base Tables — store actual transactional data (e.g., GL_JE_LINES, AP_INVOICES_ALL)
- Views — Custom database views built on top of base tables to simplify and optimize reporting access
- Synonyms & Packages — internal Oracle objects for abstraction and security
Solution Architecture
A structured, layered architecture is followed to ensure scalability, performance, and data accuracy:
End-to-end Oracle EBS to Power BI solution architecture
- Oracle EBS — source of all transactional data
- SQL Views — custom views developed on EBS tables to simplify and optimize data extraction
- Power Query — data cleansing, transformation, and shaping
- Data Model — Star Schema with Fact and Dimension tables
- DAX Measures — advanced calculations for business KPIs
- Power BI Dashboards — interactive, executive-level reports
- Power BI Service — cloud publishing with scheduled refresh and RLS security
How Do We Bring Data from EBS into Power BI?
There are 2 main methods to load Oracle EBS data into Power BI:
Option 1 — Direct Oracle DB Connection (Most Common)
- Power BI Desktop → Get Data → Oracle Database
- Requires Oracle Client (32-bit ODAC) installed on the machine
- Connect using TNS entry or direct format:
host:port/SID
Option 2 — Intermediate ETL/Staging Layer (Data Warehousing)
- EBS → ETL Tool (SSIS / Informatica) → SQL Server / Azure SQL → Power BI
- Better performance — heavy queries run on the staging database, not EBS directly
Step 1: Install Oracle Data Access Client (ODAC) — 32-bit version is required even on 64-bit machines
Step 2: Open Power BI Desktop → Get Data → Oracle Database
Step 3: Enter server name or TNS alias (e.g.,
myserver:1521/EBSDB)Step 4: Enter credentials — always use a dedicated read-only reporting Oracle user
Step 5: Select required tables or Custom SQL/Views → Load or Transform in Power Query
Power BI Dashboards — Live Demo Gallery
The following are some of the most commonly developed Power BI dashboards for Oracle EBS. Each dashboard demonstrates how business data can be transformed into meaningful insights using interactive visualizations and real-time reporting.
Dashboard 1
Financial Performance Dashboard (GL)
Provides a comprehensive view of General Ledger financials including Revenue, Expenses, Gross Profit, Net Profit, Gross Margin %, and Budget vs Actual comparison. Features year-on-year trend analysis, waterfall charts, and monthly budget tracking.
View Live Demo
Dashboard 2
Receivables Dashboard
Tracks Invoice Amount and Due Amount by customer, with year-wise breakdown. Includes Top 10 customers by Invoice Amount, Top 10 customers by Amount Due, and Due Amount by Invoice Year trend chart.
View Live Demo
Dashboard 3
Accounts Receivable Dashboard V2 (Revenue & Collection)
Advanced AR dashboard showing 208 Customers, Invoice Amount, Due Amount, Revenue and Collection for the last 12 months. Includes Monthly Revenue trend, Total AR movement, AR by Head of Unit matrix, and AR Per Group aging donut chart (1-30, 31-60, 61-90, 91-180, 181-360, 360+ days).
View Live Demo
Dashboard 4
Collection Progress (Daily Collections Chart)
Monitors daily collection activity for 172 customers across 4,064 receipts totalling 896M. Features Receipt Amount by Date bar chart, Receipt Amount by Weekday analysis, and a What-If scenario slider to model collection forecast adjustments.
View Live Demo
Dashboard 5
Procurement to Payment Analysis
Full procurement cycle dashboard covering 760M PO Amount, 771M Invoice Amount, 355M Paid, and 416M Invoice Pending. Includes monthly trend charts for PO vs Invoice vs Payment, Monthly Purchase Order Count, Top 10 Vendors by Outstanding Amount, and Payment Distribution by Method (Check, EFT, Other).
View Live Demo
Dashboard 6
Order to Cash — Invoice Analysis
End-to-end Order to Cash dashboard with 1.43bn Sales Amount, 1.31bn Invoice Amount, 1.25bn Payment Received, 95.14% Collection Rate, 14K orders, and 43.68 Avg Payment Days. Includes Sales vs Invoice vs Payment monthly trend, Top 10 Customers by Sales, Outstanding by Aging Bucket, Order-to-Cash Value Flow waterfall, and Outstanding by Customer.
View Live Demo
Dashboard 7
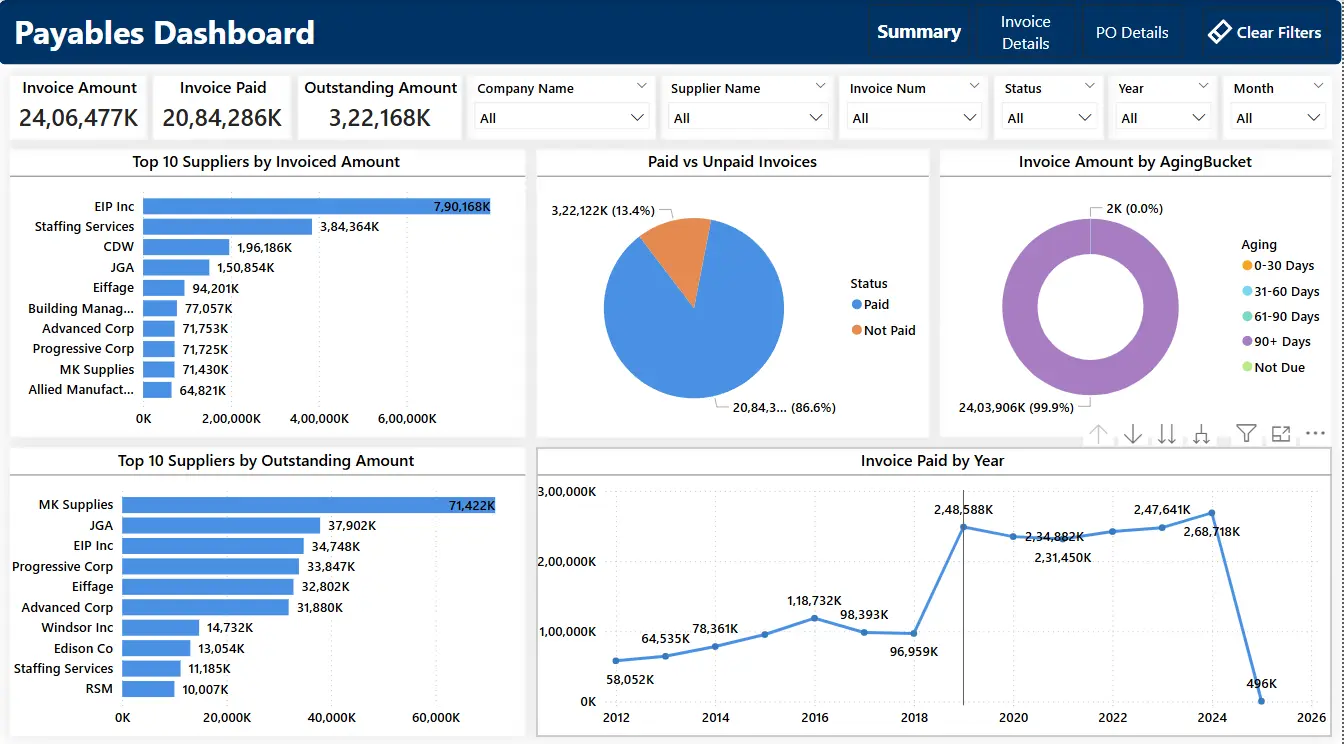
Payables Dashboard
Comprehensive Accounts Payable dashboard showing 1,700,681K Invoice Amount, 1,394,944K Invoice Paid, and 305,736K Outstanding. Features Top 10 Suppliers by Invoiced Amount, Paid vs Unpaid Invoice donut chart (83.6% paid), Invoice Amount by Ageing Bucket, Top 10 Suppliers by Outstanding Amount, and Invoice Paid by Year trend.
View Live Demo
Data Extraction from Oracle EBS — Key Tables
Data is extracted directly from Oracle EBS using optimized SQL queries and custom views. Below are the key tables per module:
5.1 General Ledger (GL)
The General Ledger module provides financial transaction and accounting information.
| Table Name | Description |
|---|---|
| GL_JE_HEADERS | Journal entry headers — batch info, date, period |
| GL_JE_LINES | Journal entry lines — debit/credit amounts, account codes |
| GL_BALANCES | Account-wise balance for each accounting period |
| GL_CODE_COMBINATIONS | Chart of accounts — account segment combinations |
Business Insights from GL:
5.2 Accounts Receivable (AR)
The Accounts Receivable module provides customer invoice and collection information.
| Table Name | Description |
|---|---|
| RA_CUSTOMER_TRX_ALL | Customer transaction headers — invoice, credit memo |
| RA_CUSTOMER_TRX_LINES_ALL | Transaction line items — amount, description |
| AR_PAYMENT_SCHEDULES_ALL | Payment schedule — due dates and amounts |
| AR_CASH_RECEIPTS_ALL | Payments received from customers |
| HZ_CUST_ACCOUNTS | Customer account master data |
| HZ_PARTIES | Party master — customer names and details |
Business Insights from AR:
5.3 Accounts Payable (AP)
The Accounts Payable module provides supplier invoice and payment information.
| Table Name | Description |
|---|---|
| AP_INVOICES_ALL | All vendor invoices across operating units |
| AP_INVOICE_DISTRIBUTIONS_ALL | Invoice distribution — GL account, amount |
| AP_PAYMENT_SCHEDULES_ALL | Payment schedule — due dates per invoice |
| AP_CHECKS_ALL | Vendor payment checks issued |
| PO_VENDORS / AP_SUPPLIERS | Supplier/vendor master information |
| AP_SUPPLIER_SITES_ALL | Vendor site-level details |
Business Insights from AP:
5.4 Procurement (PO)
The Procurement module provides purchasing and receiving information.
| Table Name | Description |
|---|---|
| PO_HEADERS_ALL | PO header — vendor, date, operating unit |
| PO_LINES_ALL | PO line items — item, quantity, unit price |
| PO_DISTRIBUTIONS_ALL | PO GL distribution — charge account codes |
| RCV_SHIPMENT_HEADERS | Receipt shipment headers |
| RCV_SHIPMENT_LINES | Receipt line-level goods received |
Business Insights from PO:
5.5 Order Management (OM)
The Order Management module provides sales order and fulfillment information.
| Table Name | Description |
|---|---|
| OE_ORDER_HEADERS_ALL | Sales order headers |
| OE_ORDER_LINES_ALL | Sales order line items — item, quantity, price |
| WSH_DELIVERY_DETAILS | Delivery detail lines for shipments |
| WSH_NEW_DELIVERIES | Delivery header — shipment tracking |
Business Insights from OM:
5.6 HRMS Module
The HRMS module provides employee and payroll information.
| Table Name | Description |
|---|---|
| PER_ALL_PEOPLE_F | Employee master — names, dates (date-tracked) |
| PER_ALL_ASSIGNMENTS_F | Employee assignments — job, grade, organization |
| PAY_PAYROLL_ACTIONS | Payroll run actions and batch details |
| PAY_RUN_RESULTS | Payroll element results — salary, deductions, taxes |
_ALL tables are Multi-Org tables — they contain data across all operating units in one place. For example, AP_INVOICES_ALL contains invoices from all operating units combined. Use the ORG_ID column to filter data for a specific operating unit. Tables without _ALL showed only the current OU's data — deprecated in Oracle R12+.
SQL View Development
Custom SQL Views are developed on top of Oracle EBS tables to simplify reporting and improve performance. The views consolidate data from multiple tables and implement business logic directly at the database layer.
Benefits:
- Faster Power BI refresh performance
- Simplified data architecture — Power BI connects to views, not raw tables
- Centralized business logic — changes made once in the view, not in every report
- Reduced report complexity and better maintainability
| View Name | Purpose |
|---|---|
| GL_LOOKUPS | Lookup values — status codes and types |
| AP_VENDORS | Supplier/vendor master information |
| AP_SUPPLIER_SITES_ALL | Vendor site-level details |
| HR_ORGANIZATION_UNITS | Operating units and organization hierarchy |
| FND_FLEX_VALUES_VL | Flex field values — chart of accounts segments |
| RA_CUSTOMERS | Customer master data |
| MTL_ITEM_CATEGORIES_V | Item categories with full hierarchy |
Creating custom views is a best practice — instead of writing complex joins directly in Power BI, build a view in Oracle and point Power BI to that view.
Example — AP Invoice Summary View:
CREATE OR REPLACE VIEW XX_AP_INVOICE_SUMMARY_V AS
SELECT ai.invoice_id,
       ai.invoice_num,
       ai.invoice_date,
       ai.invoice_amount,
       ai.amount_paid,
       ai.org_id,
       pv.vendor_name,
       pvs.vendor_site_code
FROM   ap_invoices_all      ai,
       ap_suppliers          pv,
       ap_supplier_sites_all pvs
WHERE  ai.vendor_id      = pv.vendor_id
AND    ai.vendor_site_id = pvs.vendor_site_id;
Best Practices for Custom Views:
- Always prefix with
'XX_'or company code to distinguish from Oracle standard objects - Select only required columns — avoid
SELECT * - Apply ORG_ID filter inside the view or leave it for Power BI slicers
- For date-tracked tables:
EFFECTIVE_START_DATE <= SYSDATE AND EFFECTIVE_END_DATE >= SYSDATE - Grant SELECT privilege on the view to the Power BI reporting user
Data Transformation using Power Query
After connecting Power BI to Oracle Views, data is cleaned and shaped using Power Query. The goal is to create a clean, reporting-ready dataset:
- Data Cleansing — remove unwanted characters and formatting issues
- Duplicate Removal — eliminate redundant records
- Null Handling — replace nulls with defaults or flag them
- Data Type Conversion — set correct types: Date, Decimal, Text, Integer
- Column Standardization — rename columns to business-friendly names
- Date Formatting — ensure consistent date formats across all tables
- Data Merging & Appending — combine related tables where needed
- Business Rule Implementation — apply filters, flags, and calculated columns
Data Modeling — Star Schema
Industry-standard Star Schema modeling practices are followed for all Oracle EBS to Power BI solutions. Each dashboard has a dedicated Fact Table connected to shared Dimension Tables. Below are real examples from our live Power BI dashboards.
Example 1 — Financial Performance Dashboard (GL)
This dashboard visualizes General Ledger data — Revenue, Expense, Gross Profit, Gross Margin, and Net Profit with year-on-year comparisons, Revenue by Year trend, Waterfall Value by Steps (Revenue → COGS → Operating Expense → Total), and Revenue Budget vs Actual monthly trend.

Star Schema — GL Dashboard
Source: GL_JE_HEADERS, GL_JE_LINES, GL_BALANCES
Key Columns: je_header_id, period_name, ledger_id, je_category, entered_dr, entered_cr, accounted_dr, accounted_cr, currency_code, org_id
Grain: One row per journal entry line per accounting period
Dimension Tables
Relationships: Fact_GL[period_name] → Dim_Date | Fact_GL[code_combination_id] → Dim_Account | Fact_GL[org_id] → Dim_BusinessUnit
Example 2 — Accounts Receivable Dashboard (AR)
This dashboard tracks Revenue and Collection performance — Customers count, Invoice Amount, Due Amount, Revenue last 12 months, Collection last 12 months, Monthly Revenue trend, Total AR trend, AR by Head of Unit matrix, and AR Per Group aging donut chart.
Star Schema — AR Dashboard
Source: RA_CUSTOMER_TRX_ALL, RA_CUSTOMER_TRX_LINES_ALL, AR_PAYMENT_SCHEDULES_ALL, AR_CASH_RECEIPTS_ALL
Key Columns: customer_trx_id, invoice_date, due_date, invoice_amount, amount_due_remaining, amount_applied, org_id, customer_id, gl_date
Grain: One row per customer invoice per payment schedule line
Dimension Tables
Relationships: Fact_AR[customer_id] → Dim_Customer | Fact_AR[invoice_date] → Dim_Date | Fact_AR[org_id] → Dim_BusinessUnit | Fact_AR[aging_bucket] → Dim_AgingBucket
Benefits of Star Schema
Faster query performance, better user experience with simple drag-and-drop reporting, simplified report development with shared Dim_Date and Dim_BusinessUnit, and scalable architecture — add new modules by adding new Fact tables.
DAX Measures Development
Advanced DAX measures are created to calculate key business metrics:
Financial Measures
Revenue = SUM(Fact_GL[credit_amount])
Expense = SUM(Fact_GL[debit_amount])
Gross Profit = [Revenue] - COGS
Gross Margin % = DIVIDE([Gross Profit], [Revenue], 0)
Budget vs Actual Variance = [Actual Amount] - [Budget Amount]
AP / AR Measures
Invoice Amount = SUM(Fact_AP[invoice_amount])
Outstanding Amount = [Invoice Amount] - [Total Paid]
Collection Rate % = DIVIDE([Total Collected], [Total Invoiced], 0)
Due Amount = SUMX(FILTER(...), amount_remaining)
Time Intelligence Measures
YTD Revenue = TOTALYTD([Revenue], Dim_Date[Date])
MTD Collections = TOTALMTD([Collections], Dim_Date[Date])
Prior Year Revenue = CALCULATE([Revenue], SAMEPERIODLASTYEAR(Dim_Date[Date]))
Dashboard Development
-
Data Load & Power Query Transformations — Set correct data types (Date, Decimal Number, Text). Handle nulls and replace error values. Remove unnecessary columns to keep the model lean.
-
Build the Data Model (Relationships) — Set relationships between Fact and Dimension tables following Star Schema. Mark your date table as a Date Table for time intelligence functions.
-
Create DAX Measures — Total Invoice Amount, Outstanding, Payment %, and other KPIs.
-
Design the Report — KPI Cards, Bar/Column Charts, Line Charts, Waterfall Charts, Matrix Reports, Slicers, and Drill Through pages.
-
Publish & Schedule Refresh — Publish to Power BI Service, configure On-Premises Data Gateway, and set up daily or weekly scheduled data refresh.
| Dashboard | Key Metrics & Insights |
|---|---|
| Financial Performance Dashboard | Revenue, Expenses, Gross Profit, Net Profit, Gross Margin, Budget vs Actual |
| Receivables Dashboard | Invoice Amount, Due Amount, Customer Outstanding, Receivable Aging |
| Collection Progress Dashboard | Daily Collections, Receipt Analysis, Collection Efficiency, Collection Trends |
| Procure-to-Pay Dashboard | Purchase Orders, Vendor Payments, Invoice Matching, Procurement Performance |
| Order-to-Cash Dashboard | Sales Orders, Invoice Analysis, Collection Rate, Outstanding Receivables |
| Payables Dashboard | Supplier Invoices, Outstanding Payables, Payment Aging, Vendor Analysis |
| Inventory Dashboard | Stock Levels, Slow-Moving Items, Inventory Turnover Ratio |
| HR Headcount Dashboard | Employee Count, Attrition Rate, Department-wise Strength |
Validation and Quality Assurance
Before deployment, all Power BI reports undergo a rigorous validation process:
- Financial Reconciliation — cross-check Power BI numbers against EBS reports
- Invoice Validation — verify invoice counts and amounts match source data
- Outstanding Balance Verification — confirm outstanding amounts are accurate
- Supplier Payment Verification — validate payment records
- Data Accuracy Testing — run sample checks across multiple operating units
- User Acceptance Testing (UAT) — end-user sign-off before go-live
Deployment and Security
Reports are deployed and managed through Microsoft Power BI Service with enterprise-grade security:
- Workspace Management — organized workspaces per business unit or project
- Scheduled Refresh Configuration — daily/weekly automated data refresh
- On-Premises Data Gateway — secure tunnel between Power BI Service and Oracle EBS
- Row-Level Security (RLS) — users see only their authorized data
- User Access Management — role-based access control per department
Important Tips and Common Issues
Oracle Client (32-bit)
Power BI requires 32-bit ODAC even on 64-bit systems — install the 32-bit Oracle client separately.
Performance
EBS tables are very large — always apply WHERE clause filters; never load a full table directly.
Read-Only User
Use a dedicated Oracle user with only SELECT privileges for Power BI connections.
Date-Tracked Tables
For PER_ALL_PEOPLE_F, always filter: EFFECTIVE_START_DATE <= SYSDATE AND EFFECTIVE_END_DATE >= SYSDATE
Import vs DirectQuery
Use Import Mode for EBS — DirectQuery is too slow on Oracle production databases.
ORG_ID Filter
Always filter by ORG_ID to avoid loading data across all operating units unnecessarily.
Spell Check in Word
SQL code blocks may show red lines — this is Word's spell checker, not an error in the SQL.
Technologies Used
Business Benefits
By implementing Iqra Technology's Oracle EBS to Power BI reporting solution, organizations can:
Real-Time Financial Visibility
Gain real-time visibility into financial operations across all modules.
Improved Cash Flow
Improve collection efficiency and cash flow management.
Vendor Payment Monitoring
Monitor supplier liabilities and vendor payments effectively.
Procurement Analytics
Optimize procurement performance with spend analytics.
Better Decision-Making
Improve decision-making through interactive, self-service analytics.
Eliminate Manual Reporting
Reduce manual reporting effort — eliminate Excel-based manual reports.
Operational Efficiency
Increase operational efficiency across Finance, Supply Chain, and HR.
Single Source of Truth
Achieve a single source of truth for management reporting.
Live Demo Reference
Iqra Technology has developed the following live Power BI dashboards built on Oracle EBS data. Click on any link below to explore the interactive demo:
- Dashboard 1: Financial Performance Dashboard (GL) Live Link ↗
- Dashboard 2: Receivables Dashboard Live Link ↗
- Dashboard 3: Accounts Receivable Dashboard V2 Live Link ↗
- Dashboard 4: Collection Progress Dashboard Live Link ↗
- Dashboard 5: Procurement to Payment Analysis Dashboard Live Link ↗
- Dashboard 6: Order to Cash — Invoice Analysis Dashboard Live Link ↗
- Dashboard 7: Payables Dashboard Live Link ↗
Conclusion
Iqra Technology's Oracle EBS to Power BI solution transforms complex ERP data into meaningful business insights. Through optimized SQL Views, robust Star Schema data modeling, advanced DAX calculations, and interactive dashboard design, organizations achieve complete visibility across Finance, Accounts Receivable, Accounts Payable, Procurement, and Order-to-Cash processes.
The solution empowers management with real-time, accurate, and actionable intelligence — enabling faster, data-driven decisions across the enterprise.
Explore Live Dashboard Gallery →About Iqra Technology
Iqra Technology is a leading Business Intelligence and Data Analytics consulting company specializing in Microsoft Power BI, Oracle E-Business Suite (EBS), Oracle Fusion, SQL, Data Warehousing, and Enterprise Reporting Solutions.
We help organizations transform their ERP data into meaningful business insights through interactive dashboards, automated reporting solutions, and advanced analytics.
- End-to-end Oracle EBS to Power BI dashboard development
- Custom SQL View development on Oracle EBS tables
- Star Schema data modeling for optimized report performance
- Advanced DAX calculations for financial KPIs
- Power BI Service deployment with Row-Level Security (RLS)
- On-Premises Data Gateway configuration for scheduled refresh
Demo Gallery: https://iqratechnology.com/power-bi-demo/
